Profile Data


Drift Data


Surface Data


Ascent


Descent


Hydraulic System


Engineering


Satcom


Figure Files
| Title | Category | Files | ||
|---|---|---|---|---|
| 1 | Ascent | ascent |  | ascent .html (1401.3kB) .png [390x415] (37.0kB) .png [900x900] (117.6kB) |
| 2 | Average Ascent Rate | ascent |  | ascent_rate_avg .html (86.0kB) .png [390x415] (34.2kB) .png [900x900] (72.9kB) |
| 3 | Ascent Rate | ascent |  | ascent_rate_v_pres .html (1178.8kB) .png [390x415] (66.3kB) .png [900x900] (252.6kB) |
| 4 | Ascent Rate | ascent |  | ascent_rate_v_time .html (1383.6kB) .png [390x415] (29.8kB) .png [900x900] (84.0kB) |
| 5 | No. Ascent Samples | ascent |  | ascent_sample_count .html (13.2kB) .png [780x215] (21.5kB) .png [1600x900] (59.0kB) |
| 6 | Dive Cycle Duration | cycle_timing |  | cycle_timing .html (69.1kB) .png [780x315] (19.8kB) .png [1600x900] (50.0kB) |
| 7 | Descent | descent |  | descent .html (1648.0kB) .png [390x415] (85.4kB) .png [900x900] (326.0kB) |
| 8 | Average Descent Rate | descent |  | descent_rate_avg .html (84.3kB) .png [390x415] (33.3kB) .png [900x900] (69.7kB) |
| 9 | Descent Rate | descent |  | descent_rate_v_pres .html (1403.4kB) .png [390x415] (51.6kB) .png [900x900] (202.2kB) |
| 10 | Descent Rate | descent |  | descent_rate_v_time .html (1649.4kB) .png [390x415] (44.6kB) .png [900x900] (178.5kB) |
| 11 | No. Descent Samples | descent |  | descent_sample_count .html (13.2kB) .png [780x215] (20.2kB) .png [1600x900] (56.0kB) |
| 12 | Submerged Dispacement | displacement |  | displacement_submerged .html (249.8kB) .png [390x415] (42.0kB) .png [900x900] (102.5kB) |
| 13 | Submerged Velocity | displacement |  | displacement_submerged_velocity .html (250.8kB) .png [390x415] (74.9kB) .png [900x900] (166.1kB) |
| 14 | Surface Dispacement | displacement |  | displacement_surface .html (247.8kB) .png [390x415] (56.1kB) .png [900x900] (139.9kB) |
| 15 | Surface Velocity | displacement |  | displacement_surface_velocity .html (248.5kB) .png [390x415] (80.8kB) .png [900x900] (180.1kB) |
| 16 | Drift Pressure | drift |  | drift_pres .html (198.1kB) .png [390x415] (84.0kB) .png [900x900] (248.2kB) |
| 17 | Average Drift Pressure | drift |  | drift_pres_avg .html (17.2kB) .png [390x415] (29.8kB) .png [900x900] (68.7kB) |
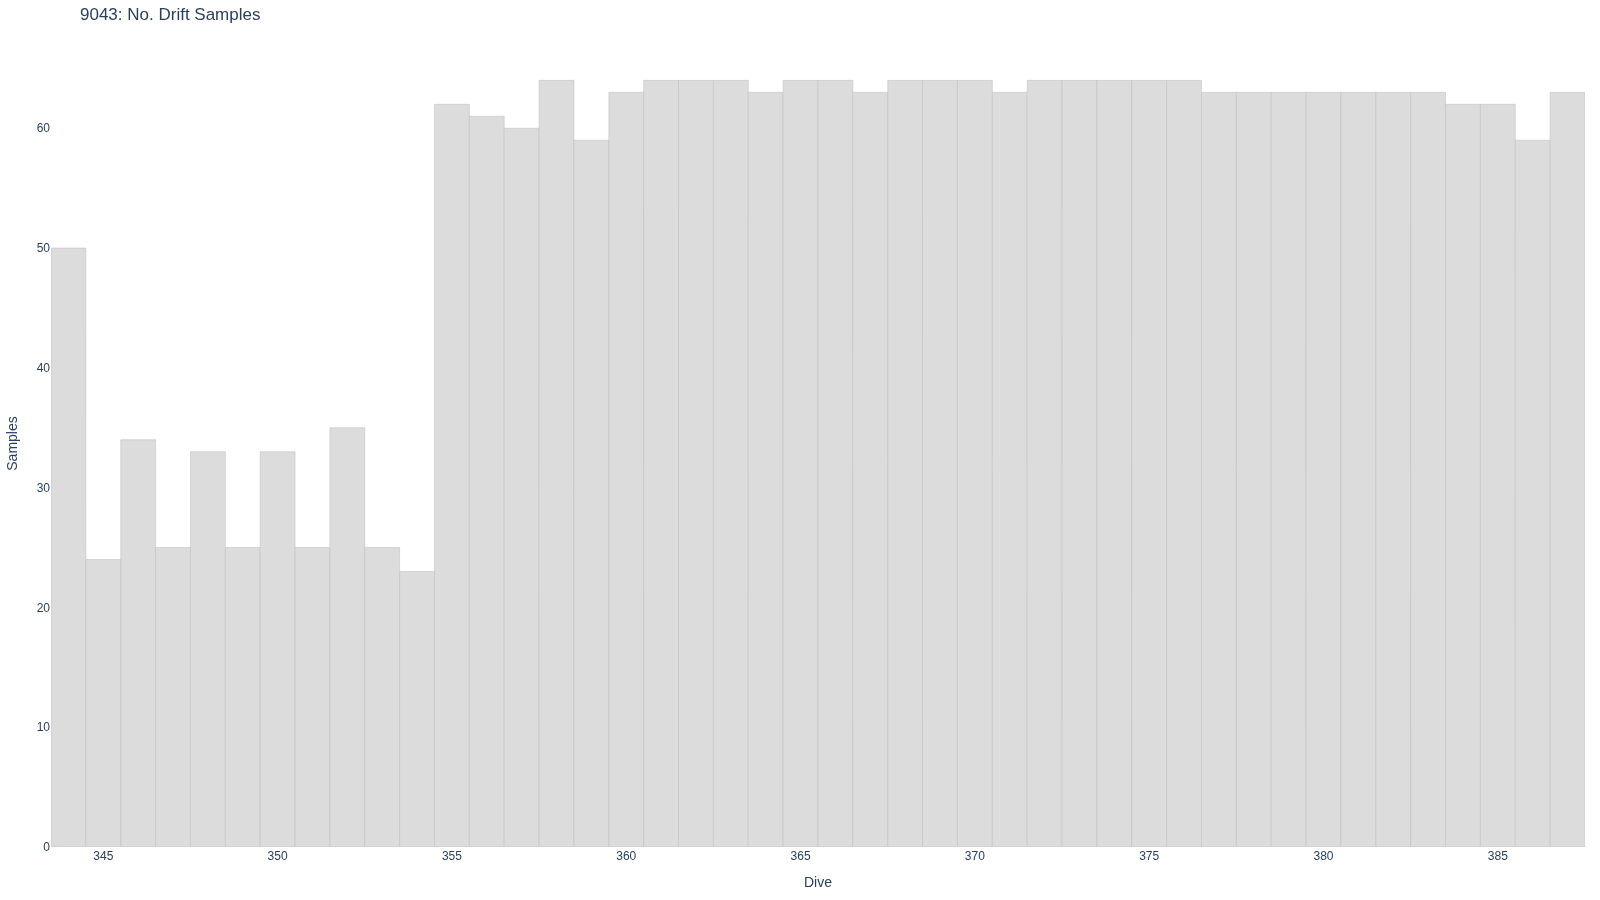
| 18 | No. Drift Samples | drift |  | drift_sample_count .html (8.2kB) .png [780x215] (16.7kB) .png [1600x900] (48.0kB) |
| 19 | Drift Temperature | drift |  | drift_temp .html (204.7kB) .png [390x415] (93.6kB) .png [900x900] (272.1kB) |
| 20 | Average Drift Temperature | drift |  | drift_temp_avg .html (17.3kB) .png [390x415] (29.9kB) .png [900x900] (65.0kB) |
| 21 | Estimated Total Energy 852.9 kJ in 387 dives (1–387) | energy |  | energy_by_component .html (11.5kB) .png [780x115] (20.3kB) .png [1600x300] (34.0kB) |
| 22 | Estimated Energy Use per Cycle, Total = 852.9 kJ | energy |  | energy_per_cycle .html (70.0kB) .png [780x315] (32.3kB) .png [1600x900] (73.8kB) |
| 23 | Case Vacuum through the Dive Cycle | pump |  | phase_vac .html (8.3kB) .png [780x415] (31.6kB) .png [1600x900] (51.9kB) |
| 24 | Profile Positions and Bathymetry | position |  | position .html (1010.2kB) .png [390x415] (204.9kB) .png [900x900] (476.8kB) |
| 25 | All Positions | position |  | position_all .html (1159.0kB) .png [390x415] (73.8kB) .png [900x900] (177.6kB) |
| 26 | Profile Positions (Map) | position |  | position_geo .html (210.7kB) .png [390x415] (45.9kB) .png [900x900] (107.4kB) |
| 27 | Profile Positions | position |  | position_globe .html (210.7kB) .png [390x415] (65.4kB) .png [900x900] (188.7kB) |
| 28 | GPS Positions | position |  | position_gps .html (620.7kB) .png [390x415] (51.3kB) .png [900x900] (120.0kB) |
| 29 | Temperature Contour | profile_contour |  | profile_contour_temp .html (2235.9kB) .png [780x515] (299.6kB) .png [1600x900] (930.7kB) |
| 30 | No. Profile Bins | profile |  | profile_num_bins .html (10.1kB) .png [780x215] (22.2kB) .png [1600x900] (64.3kB) |
| 31 | Temperature Profiles | profile |  | profile_temp .html (4748.0kB) .png [390x415] (54.6kB) .png [900x900] (248.1kB) |
| 32 | Pump Battery Current | pump |  | pump_curr .html (730.4kB) .png [390x415] (55.4kB) .png [900x900] (183.0kB) |
| 33 | Average Pump Battery Current | pump |  | pump_curr_avg .html (89.0kB) .png [390x415] (36.7kB) .png [900x900] (84.0kB) |
| 34 | Pump Energy | pump |  | pump_energy .html (731.4kB) .png [390x415] (37.7kB) .png [900x900] (108.2kB) |
| 35 | Total Pump Energy per Cycle | pump |  | pump_energy_sum .html (206.6kB) .png [780x215] (31.7kB) .png [1600x900] (107.1kB) |
| 36 | Total Pump Energy vs. Max. Pres. | pump |  | pump_energy_v_max_pres .html (208.8kB) .png [390x415] (41.7kB) .png [900x900] (95.2kB) |
| 37 | First Pump Duration and Seek Adjustment | pump |  | pump_first_duration .html (13.3kB) .png [780x315] (25.5kB) .png [1600x900] (56.9kB) |
| 38 | No. Pump Operations per Cycle | pump |  | pump_num_ops .html (9.6kB) .png [780x215] (21.9kB) .png [1600x900] (56.7kB) |
| 39 | Pump Power | pump |  | pump_power .html (730.0kB) .png [390x415] (64.7kB) .png [900x900] (227.3kB) |
| 40 | Average Pump Power | pump |  | pump_power_avg .html (88.0kB) .png [390x415] (40.0kB) .png [900x900] (94.6kB) |
| 41 | Pump Power vs. Pressure | pump |  | pump_power_v_pres .html (812.6kB) .png [390x415] (63.6kB) .png [900x900] (209.2kB) |
| 42 | Pump Pressure | pump |  | pump_pres .html (731.5kB) .png [390x415] (87.1kB) .png [900x900] (273.3kB) |
| 43 | Total Pump Duration per Cycle | pump |  | pump_time_sum .html (189.1kB) .png [780x215] (25.6kB) .png [1600x900] (92.4kB) |
| 44 | Internal Vacuum vs. Pump | pump |  | pump_vac .html (544.6kB) .png [390x415] (97.6kB) .png [900x900] (365.1kB) |
| 45 | Average Internal Vacuum (Pump) | pump |  | pump_vac_avg .html (83.6kB) .png [390x415] (48.8kB) .png [900x900] (127.0kB) |
| 46 | Internal Vac. vs. Pump Pressure | pump |  | pump_vac_v_pres .html (628.3kB) .png [390x415] (154.0kB) .png [900x900] (790.2kB) |
| 47 | Internal Vacuum vs. Pump Time | pump |  | pump_vac_v_time .html (628.3kB) .png [390x415] (79.9kB) .png [900x900] (292.3kB) |
| 48 | Pump Battery Voltage | pump |  | pump_volt .html (731.3kB) .png [390x415] (47.3kB) .png [900x900] (134.3kB) |
| 49 | Average Pump Battery Voltage | pump |  | pump_volt_avg .html (86.5kB) .png [390x415] (24.0kB) .png [900x900] (60.9kB) |
| 50 | Satcom | satcom |  | satcom .html (359.8kB) .png [780x615] (297.9kB) .png [1600x900] (378.2kB) |
| 51 | GPS Carrier-to-Noise (CNO) Ratio | satcom |  | satcom_gps_cno .html (129.1kB) .png [390x415] (195.6kB) .png [900x900] (594.2kB) |
| 52 | GPS Fix Uncertainty Est. | satcom |  | satcom_gps_fix_cep .html (65.4kB) .png [390x415] (132.5kB) .png [900x900] (213.1kB) |
| 53 | GPS Horiz. Dilution of Precision | satcom |  | satcom_gps_hdop .html (63.9kB) .png [390x415] (141.0kB) .png [900x900] (206.2kB) |
| 54 | GPS No. Satellites | satcom |  | satcom_gps_nsat .html (56.2kB) .png [390x415] (58.6kB) .png [900x900] (120.2kB) |
| 55 | GPS Time-to-fix (TTF) | satcom |  | satcom_gps_ttf .html (56.9kB) .png [390x415] (110.6kB) .png [900x900] (162.7kB) |
| 56 | Iridium Fix Uncertainty | satcom |  | satcom_iridium_fix_cep_avg .html (93.3kB) .png [390x415] (75.5kB) .png [900x900] (214.5kB) |
| 57 | No. SBD Messages | satcom |  | satcom_sbd_count .html (13.7kB) .png [780x215] (19.6kB) .png [1600x900] (53.6kB) |
| 58 | SBD Data Size | satcom |  | satcom_sbd_data_size .html (13.1kB) .png [780x215] (23.5kB) .png [1600x900] (65.5kB) |
| 59 | SBD Message Average Size | satcom |  | satcom_sbd_data_size_avg .html (82.3kB) .png [390x415] (42.3kB) .png [900x900] (106.5kB) |
| 60 | Surface Pressure | surface |  | surface_pres .html (348.4kB) .png [390x415] (54.8kB) .png [900x900] (225.3kB) |
| 61 | Average Surface Pressure | surface |  | surface_pres_avg .html (94.7kB) .png [390x415] (40.1kB) .png [900x900] (96.5kB) |
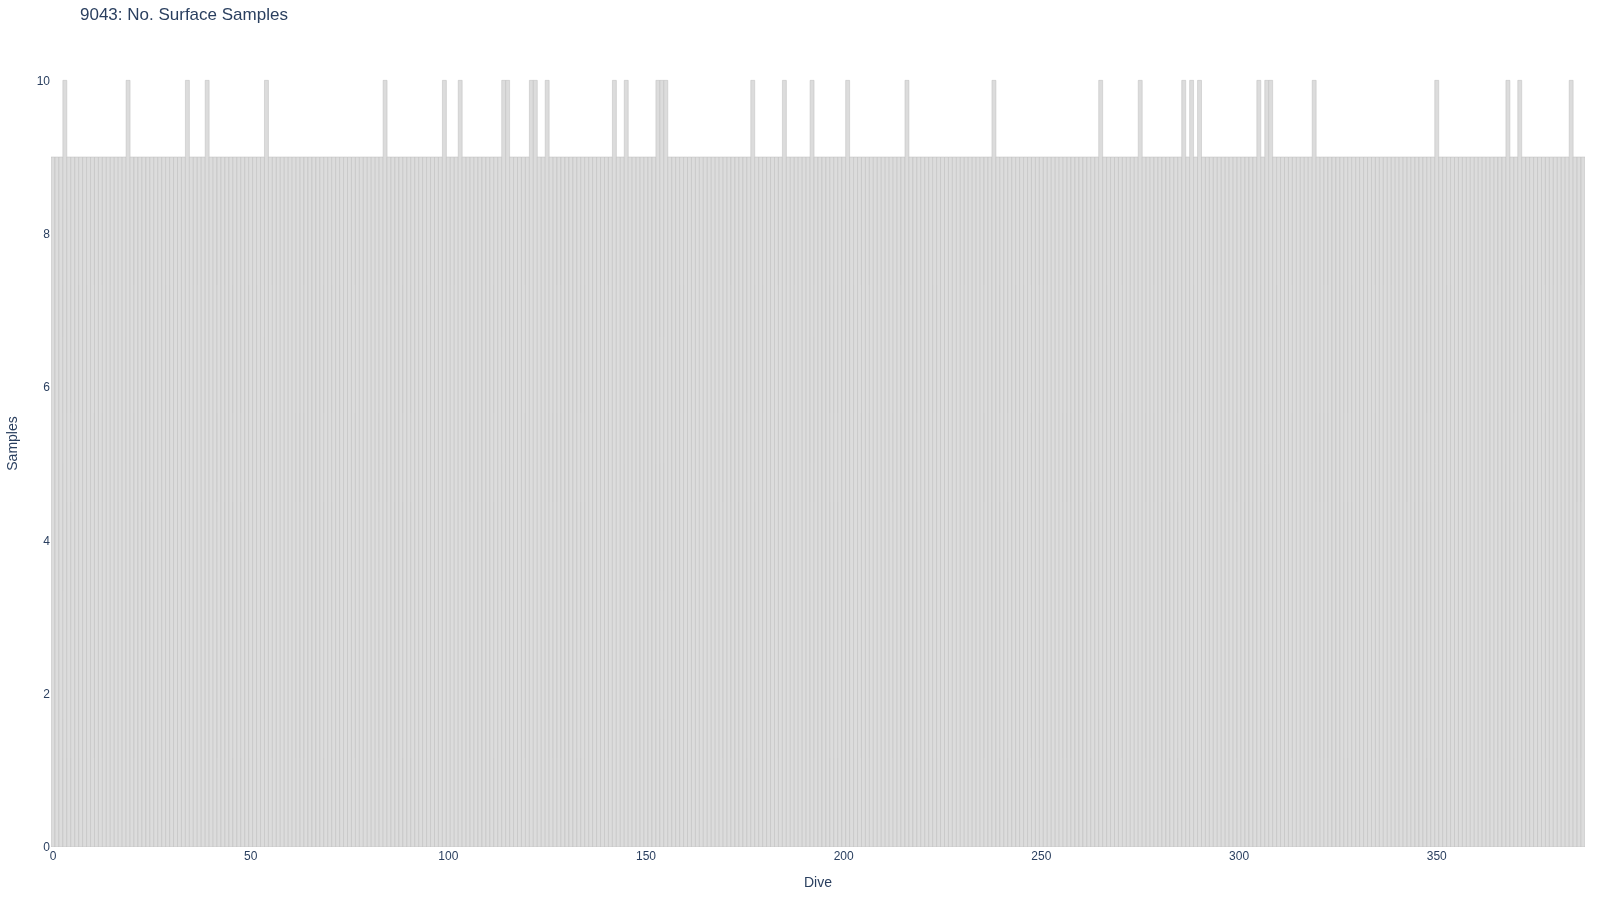
| 62 | No. Surface Samples | surface | 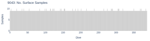 | surface_sample_count .html (9.6kB) .png [780x215] (18.6kB) .png [1600x900] (54.3kB) |
| 63 | Trajectory | trajectory |  | trajectory .html (2314.7kB) .png [780x515] (190.7kB) .png [1600x900] (584.1kB) |