


Profile Data


Drift Data


Surface Data


Ascent


Descent


Hydraulic System


")


Satcom


 Ratio")


")


Figure Files
| Title | Category | Files | ||
|---|---|---|---|---|
| 1 | Ascent | ascent | 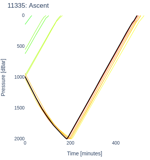 | ascent .html (650.2kB) .png [390x415] (54.3kB) .png [900x900] (220.4kB) .svg [390x415] (43.1kB) .svg [900x900] (59.5kB) |
| 2 | Average Ascent Rate | ascent | 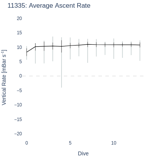 | ascent_rate_avg .html (19.5kB) .png [390x415] (24.3kB) .png [900x900] (50.2kB) .svg [390x415] (27.5kB) .svg [900x900] (28.8kB) |
| 3 | Ascent Rate | ascent | 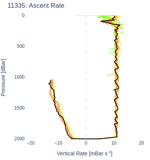 | ascent_rate_v_pres .html (537.2kB) .png [390x415] (54.9kB) .png [900x900] (235.4kB) .svg [390x415] (119.2kB) .svg [900x900] (150.3kB) |
| 4 | Ascent Rate | ascent | 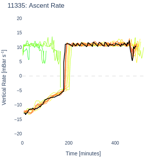 | ascent_rate_v_time .html (642.3kB) .png [390x415] (57.3kB) .png [900x900] (234.5kB) .svg [390x415] (111.9kB) .svg [900x900] (148.1kB) |
| 5 | No. Ascent Samples | ascent |  | ascent_sample_count .html (8.8kB) .png [780x215] (16.8kB) .png [1600x900] (78.0kB) .svg [780x215] (16.6kB) .svg [1600x900] (18.0kB) |
| 6 | Dive Cycle Duration | cycle_timing |  | cycle_timing .html (18.1kB) .png [780x315] (17.0kB) .png [1600x900] (43.8kB) .svg [780x315] (62.7kB) .svg [1600x900] (62.9kB) |
| 7 | Descent | descent | 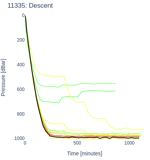 | descent .html (434.0kB) .png [390x415] (39.9kB) .png [900x900] (134.6kB) .svg [390x415] (59.4kB) .svg [900x900] (74.1kB) |
| 8 | Average Descent Rate | descent | 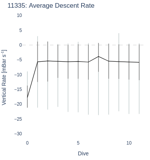 | descent_rate_avg .html (19.2kB) .png [390x415] (26.8kB) .png [900x900] (61.5kB) .svg [390x415] (27.0kB) .svg [900x900] (28.4kB) |
| 9 | Descent Rate | descent | 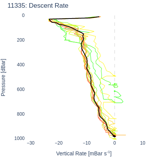 | descent_rate_v_pres .html (365.8kB) .png [390x415] (55.8kB) .png [900x900] (214.5kB) .svg [390x415] (97.2kB) .svg [900x900] (105.6kB) |
| 10 | Descent Rate | descent | 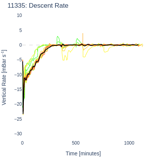 | descent_rate_v_time .html (432.6kB) .png [390x415] (36.9kB) .png [900x900] (125.0kB) .svg [390x415] (88.2kB) .svg [900x900] (107.5kB) |
| 11 | No. Descent Samples | descent |  | descent_sample_count .html (8.8kB) .png [780x215] (17.1kB) .png [1600x900] (89.5kB) .svg [780x215] (17.4kB) .svg [1600x900] (19.1kB) |
| 12 | Submerged Dispacement | displacement | 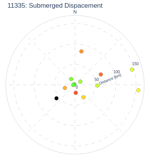 | displacement_submerged .html (40.0kB) .png [390x415] (38.6kB) .png [900x900] (81.0kB) .svg [390x415] (28.2kB) .svg [900x900] (28.4kB) |
| 13 | Submerged Velocity | displacement | 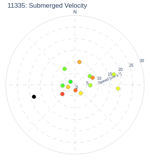 | displacement_submerged_velocity .html (40.1kB) .png [390x415] (39.9kB) .png [900x900] (87.0kB) .svg [390x415] (29.5kB) .svg [900x900] (29.7kB) |
| 14 | Surface Dispacement | displacement | 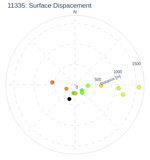 | displacement_surface .html (39.2kB) .png [390x415] (35.9kB) .png [900x900] (80.3kB) .svg [390x415] (27.9kB) .svg [900x900] (27.9kB) |
| 15 | Surface Velocity | displacement | 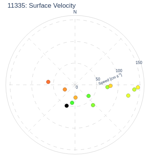 | displacement_surface_velocity .html (39.4kB) .png [390x415] (37.1kB) .png [900x900] (81.6kB) .svg [390x415] (27.9kB) .svg [900x900] (28.0kB) |
| 16 | Drift In-Situ Density | drift | 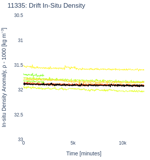 | drift_dens .html (1496.3kB) .png [390x415] (52.4kB) .png [900x900] (246.3kB) .svg [390x415] (237.9kB) .svg [900x900] (268.1kB) |
| 17 | Average Drift In-Situ Density | drift | 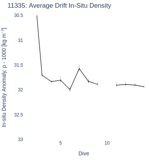 | drift_dens_avg .html (19.5kB) .png [390x415] (26.2kB) .png [900x900] (53.8kB) .svg [390x415] (24.8kB) .svg [900x900] (25.9kB) |
| 18 | Drift Pressure | drift | 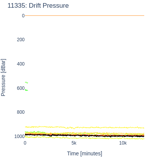 | drift_pres .html (1457.7kB) .png [390x415] (35.3kB) .png [900x900] (137.7kB) .svg [390x415] (220.1kB) .svg [900x900] (262.7kB) |
| 19 | Average Drift Pressure | drift | 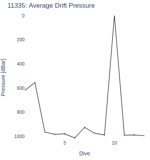 | drift_pres_avg .html (18.6kB) .png [390x415] (27.5kB) .png [900x900] (65.6kB) .svg [390x415] (25.1kB) .svg [900x900] (26.4kB) |
| 20 | Drift Salinity | drift | 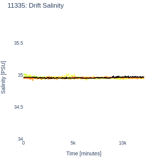 | drift_saln .html (1481.1kB) .png [390x415] (23.2kB) .png [900x900] (86.4kB) .svg [390x415] (151.0kB) .svg [900x900] (222.7kB) |
| 21 | Average Drift Salinity | drift | 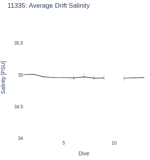 | drift_saln_avg .html (18.8kB) .png [390x415] (17.5kB) .png [900x900] (39.6kB) .svg [390x415] (24.0kB) .svg [900x900] (27.8kB) |
| 22 | No. Drift Samples | drift |  | drift_sample_count .html (8.3kB) .png [780x215] (18.0kB) .png [1600x900] (77.5kB) .svg [780x215] (16.9kB) .svg [1600x900] (18.7kB) |
| 23 | Drift Potential Density | drift | 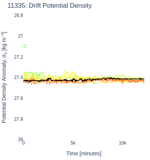 | drift_sigma0 .html (1478.5kB) .png [390x415] (43.0kB) .png [900x900] (181.7kB) .svg [390x415] (189.8kB) .svg [900x900] (227.6kB) |
| 24 | Average Drift In-Situ Density | drift | 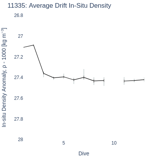 | drift_sigma0_avg .html (19.1kB) .png [390x415] (25.1kB) .png [900x900] (49.9kB) .svg [390x415] (24.9kB) .svg [900x900] (26.2kB) |
| 25 | Drift Temperature | drift | 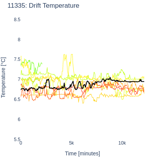 | drift_temp .html (1479.4kB) .png [390x415] (102.0kB) .png [900x900] (472.1kB) .svg [390x415] (207.7kB) .svg [900x900] (253.6kB) |
| 26 | Average Drift Temperature | drift | 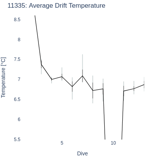 | drift_temp_avg .html (18.9kB) .png [390x415] (30.5kB) .png [900x900] (72.0kB) .svg [390x415] (25.2kB) .svg [900x900] (26.5kB) |
| 27 | Profile Positions | position | 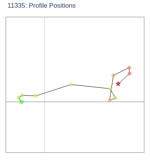 | position .html (42.9kB) .png [390x415] (28.4kB) .png [900x900] (60.2kB) .svg [390x415] (21.6kB) .svg [900x900] (21.5kB) |
| 28 | All Positions | position | 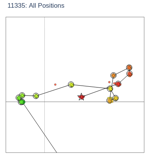 | position_all .html (224.4kB) .png [390x415] (42.1kB) .png [900x900] (87.7kB) .svg [390x415] (546.5kB) .svg [900x900] (545.4kB) |
| 29 | Profile Positions | position | 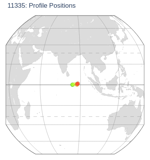 | position_globe .html (43.0kB) .png [390x415] (49.5kB) .png [900x900] (140.3kB) .svg [390x415] (1606.1kB) .svg [900x900] (1597.9kB) |
| 30 | GPS Positions | position | 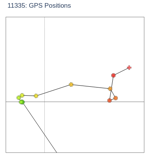 | position_gps .html (113.2kB) .png [390x415] (34.7kB) .png [900x900] (71.4kB) .svg [390x415] (47.0kB) .svg [900x900] (47.0kB) |
| 31 | In-situ Density Contour | profile_contour | 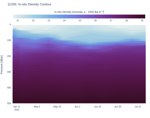 | profile_contour_dens .html (616.4kB) .png [780x615] (203.7kB) .png [1600x900] (458.5kB) .svg [780x615] (296.5kB) .svg [1600x900] (565.2kB) |
| 32 | Salinity Contour | profile_contour | 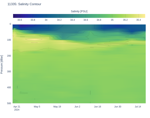 | profile_contour_saln .html (518.6kB) .png [780x615] (207.3kB) .png [1600x900] (491.8kB) .svg [780x615] (364.8kB) .svg [1600x900] (633.5kB) |
| 33 | Potential Density Contour | profile_contour | 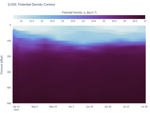 | profile_contour_sigma0 .html (519.6kB) .png [780x615] (206.7kB) .png [1600x900] (488.6kB) .svg [780x615] (376.6kB) .svg [1600x900] (665.2kB) |
| 34 | Temperature Contour | profile_contour | 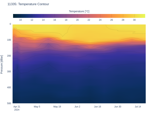 | profile_contour_temp .html (519.0kB) .png [780x615] (244.2kB) .png [1600x900] (577.3kB) .svg [780x615] (397.1kB) .svg [1600x900] (748.6kB) |
| 35 | In-situ Density Profiles | profile | 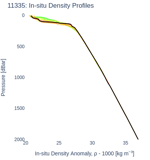 | profile_dens .html (5461.6kB) .png [390x415] (29.4kB) .png [900x900] (83.5kB) .svg [390x415] (69.6kB) .svg [900x900] (136.6kB) |
| 36 | No. Profile Bins | profile |  | profile_num_bins .html (8.3kB) .png [780x215] (16.0kB) .png [1600x900] (83.3kB) .svg [780x215] (17.4kB) .svg [1600x900] (17.5kB) |
| 37 | Salinity Profiles | profile | 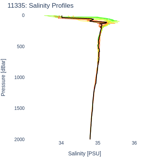 | profile_saln .html (4363.6kB) .png [390x415] (32.0kB) .png [900x900] (106.5kB) .svg [390x415] (156.8kB) .svg [900x900] (296.4kB) |
| 38 | Potential Density Profiles | profile | 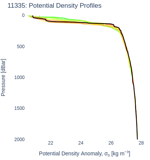 | profile_sigma0 .html (4363.5kB) .png [390x415] (34.3kB) .png [900x900] (110.9kB) .svg [390x415] (120.6kB) .svg [900x900] (238.3kB) |
| 39 | Temperature Profiles | profile | 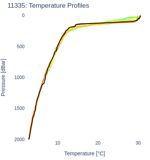 | profile_temp .html (4364.0kB) .png [390x415] (34.5kB) .png [900x900] (127.7kB) .svg [390x415] (138.5kB) .svg [900x900] (263.7kB) |
| 40 | T-S Profiles | profile | 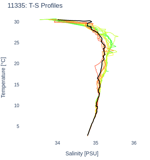 | profile_ts .html (4364.2kB) .png [390x415] (54.3kB) .png [900x900] (202.9kB) .svg [390x415] (154.4kB) .svg [900x900] (301.3kB) |
| 41 | Pump Battery Current | pump | 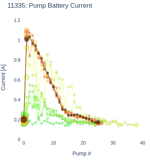 | pump_curr .html (123.1kB) .png [390x415] (72.5kB) .png [900x900] (229.7kB) .svg [390x415] (293.7kB) .svg [900x900] (296.7kB) |
| 42 | Average Pump Battery Current | pump | 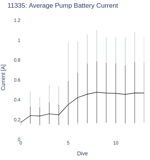 | pump_curr_avg .html (19.7kB) .png [390x415] (26.1kB) .png [900x900] (60.5kB) .svg [390x415] (26.7kB) .svg [900x900] (28.0kB) |
| 43 | Pump Energy | pump | 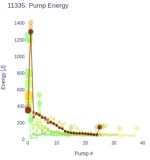 | pump_energy .html (123.3kB) .png [390x415] (49.9kB) .png [900x900] (145.7kB) .svg [390x415] (291.9kB) .svg [900x900] (295.3kB) |
| 44 | Total Pump Energy per Cycle | pump |  | pump_energy_sum .html (8.8kB) .png [780x215] (19.0kB) .png [1600x900] (94.9kB) .svg [780x215] (17.2kB) .svg [1600x900] (18.6kB) |
| 45 | Total Pump Energy vs. Max. Pres. | pump | 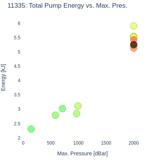 | pump_energy_v_max_pres .html (35.8kB) .png [390x415] (24.6kB) .png [900x900] (43.2kB) .svg [390x415] (30.4kB) .svg [900x900] (29.6kB) |
| 46 | No. Pump Operations per Cycle | pump |  | pump_num_ops .html (8.2kB) .png [780x215] (17.5kB) .png [1600x900] (73.7kB) .svg [780x215] (17.6kB) .svg [1600x900] (19.4kB) |
| 47 | Pump Power | pump | 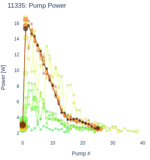 | pump_power .html (123.2kB) .png [390x415] (79.7kB) .png [900x900] (263.8kB) .svg [390x415] (293.9kB) .svg [900x900] (297.0kB) |
| 48 | Average Pump Power | pump | 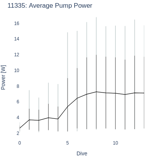 | pump_power_avg .html (19.0kB) .png [390x415] (26.5kB) .png [900x900] (65.3kB) .svg [390x415] (27.1kB) .svg [900x900] (28.3kB) |
| 49 | Pump Power vs. Pressure | pump | 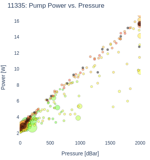 | pump_power_v_pres .html (136.6kB) .png [390x415] (54.9kB) .png [900x900] (117.2kB) .svg [390x415] (270.3kB) .svg [900x900] (270.6kB) |
| 50 | Pump Pressure | pump | 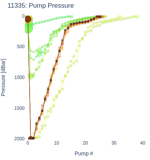 | pump_pres .html (123.1kB) .png [390x415] (70.5kB) .png [900x900] (207.4kB) .svg [390x415] (287.0kB) .svg [900x900] (290.5kB) |
| 51 | Total Pump Duration per Cycle | pump |  | pump_time_sum .html (8.7kB) .png [780x215] (18.9kB) .png [1600x900] (84.7kB) .svg [780x215] (16.9kB) .svg [1600x900] (18.2kB) |
| 52 | Internal Vacuum vs. Pump | pump | 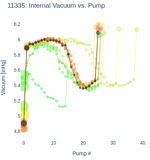 | pump_vac .html (93.2kB) .png [390x415] (79.0kB) .png [900x900] (239.7kB) .svg [390x415] (293.1kB) .svg [900x900] (296.7kB) |
| 53 | Average Internal Vacuum (Pump) | pump | 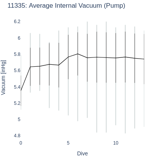 | pump_vac_avg .html (19.2kB) .png [390x415] (29.1kB) .png [900x900] (69.3kB) .svg [390x415] (27.0kB) .svg [900x900] (28.3kB) |
| 54 | Internal Vac. vs. Pump Pressure | pump | 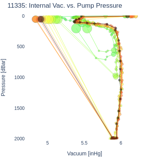 | pump_vac_v_pres .html (106.9kB) .png [390x415] (85.2kB) .png [900x900] (348.8kB) .svg [390x415] (288.4kB) .svg [900x900] (291.2kB) |
| 55 | Internal Vacuum vs. Pump Time | pump | 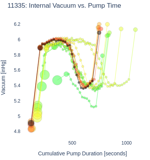 | pump_vac_v_time .html (106.9kB) .png [390x415] (82.2kB) .png [900x900] (281.6kB) .svg [390x415] (292.7kB) .svg [900x900] (295.6kB) |
| 56 | Pump Battery Voltage | pump | 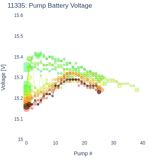 | pump_volt .html (123.3kB) .png [390x415] (71.8kB) .png [900x900] (188.5kB) .svg [390x415] (293.0kB) .svg [900x900] (290.4kB) |
| 57 | Average Pump Battery Voltage | pump | 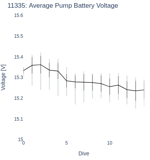 | pump_volt_avg .html (19.2kB) .png [390x415] (26.8kB) .png [900x900] (55.8kB) .svg [390x415] (27.2kB) .svg [900x900] (28.5kB) |
| 58 | Satcom | satcom |  | satcom .html (166.4kB) .png [780x615] (82.4kB) .png [1600x900] (109.3kB) .svg [780x615] (453.9kB) .svg [1600x900] (454.8kB) |
| 59 | GPS Carrier-to-Noise (CNO) Ratio | satcom | 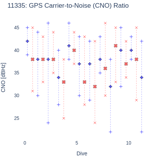 | satcom_gps_cno .html (18.6kB) .png [390x415] (53.6kB) .png [900x900] (116.0kB) .svg [390x415] (120.5kB) .svg [900x900] (122.7kB) |
| 60 | GPS Fix Uncertainty Est. | satcom | 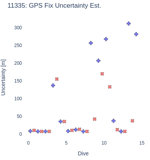 | satcom_gps_fix_cep .html (15.8kB) .png [390x415] (38.1kB) .png [900x900] (60.1kB) .svg [390x415] (37.5kB) .svg [900x900] (38.7kB) |
| 61 | GPS Horiz. Dilution of Precision | satcom | 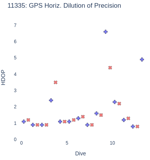 | satcom_gps_hdop .html (15.6kB) .png [390x415] (38.9kB) .png [900x900] (60.2kB) .svg [390x415] (38.3kB) .svg [900x900] (39.5kB) |
| 62 | GPS No. Satellites | satcom | 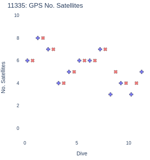 | satcom_gps_nsat .html (14.6kB) .png [390x415] (22.8kB) .png [900x900] (51.6kB) .svg [390x415] (37.3kB) .svg [900x900] (38.6kB) |
| 63 | GPS Time-to-fix (TTF) | satcom | 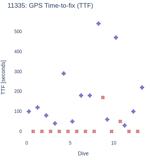 | satcom_gps_ttf .html (14.6kB) .png [390x415] (40.6kB) .png [900x900] (63.4kB) .svg [390x415] (37.1kB) .svg [900x900] (40.0kB) |
| 64 | Iridium Fix Uncertainty | satcom | 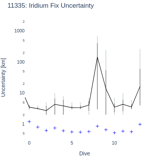 | satcom_iridium_fix_cep_avg .html (23.1kB) .png [390x415] (40.0kB) .png [900x900] (94.5kB) .svg [390x415] (45.0kB) .svg [900x900] (46.2kB) |
| 65 | No. SBD Messages | satcom |  | satcom_sbd_count .html (9.1kB) .png [780x215] (17.7kB) .png [1600x900] (81.6kB) .svg [780x215] (19.7kB) .svg [1600x900] (21.5kB) |
| 66 | SBD Data Size | satcom |  | satcom_sbd_data_size .html (9.1kB) .png [780x215] (15.8kB) .png [1600x900] (83.3kB) .svg [780x215] (19.3kB) .svg [1600x900] (21.1kB) |
| 67 | SBD Message Average Size | satcom | 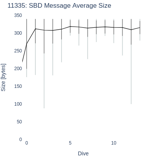 | satcom_sbd_data_size_avg .html (21.2kB) .png [390x415] (28.2kB) .png [900x900] (63.8kB) .svg [390x415] (30.8kB) .svg [900x900] (32.3kB) |
| 68 | Surface Pressure | surface | 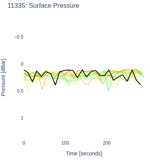 | surface_pres .html (77.2kB) .png [390x415] (51.6kB) .png [900x900] (199.3kB) .svg [390x415] (30.6kB) .svg [900x900] (31.9kB) |
| 69 | Average Surface Pressure | surface | 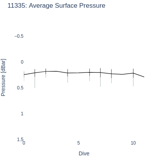 | surface_pres_avg .html (19.3kB) .png [390x415] (21.9kB) .png [900x900] (46.0kB) .svg [390x415] (22.5kB) .svg [900x900] (23.7kB) |
| 70 | No. Surface Samples | surface | 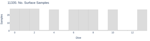 | surface_sample_count .html (8.3kB) .png [780x215] (17.1kB) .png [1600x900] (79.8kB) .svg [780x215] (16.6kB) .svg [1600x900] (17.9kB) |
| 71 | Surface Temperature | surface | 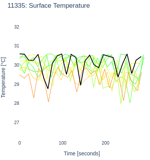 | surface_temp .html (80.0kB) .png [390x415] (122.6kB) .png [900x900] (465.9kB) .svg [390x415] (31.5kB) .svg [900x900] (33.0kB) |
| 72 | Average Surface Temperature | surface | 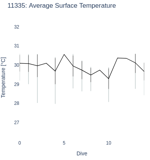 | surface_temp_avg .html (19.0kB) .png [390x415] (31.0kB) .png [900x900] (72.2kB) .svg [390x415] (23.4kB) .svg [900x900] (24.7kB) |
| 73 | Trajectory | trajectory |  | trajectory .html (1547.9kB) .png [780x515] (142.0kB) .png [1600x900] (276.1kB) .svg [780x515] (720.3kB) .svg [1600x900] (764.7kB) |
![.png [900x900]](11335_ascent.png)
![.svg [390x415]](11335_ascent_small.svg)
![.svg [900x900]](11335_ascent.svg)
![.png [900x900]](11335_ascent_rate_avg.png)
![.svg [390x415]](11335_ascent_rate_avg_small.svg)
![.svg [900x900]](11335_ascent_rate_avg.svg)
![.png [900x900]](11335_ascent_rate_v_pres.png)
![.svg [390x415]](11335_ascent_rate_v_pres_small.svg)
![.svg [900x900]](11335_ascent_rate_v_pres.svg)
![.png [900x900]](11335_ascent_rate_v_time.png)
![.svg [390x415]](11335_ascent_rate_v_time_small.svg)
![.svg [900x900]](11335_ascent_rate_v_time.svg)
![.png [1600x900]](11335_ascent_sample_count.png)
![.svg [780x215]](11335_ascent_sample_count_small.svg)
![.svg [1600x900]](11335_ascent_sample_count.svg)
![.png [1600x900]](11335_cycle_timing.png)
![.svg [780x315]](11335_cycle_timing_small.svg)
![.svg [1600x900]](11335_cycle_timing.svg)
![.png [900x900]](11335_descent.png)
![.svg [390x415]](11335_descent_small.svg)
![.svg [900x900]](11335_descent.svg)
![.png [900x900]](11335_descent_rate_avg.png)
![.svg [390x415]](11335_descent_rate_avg_small.svg)
![.svg [900x900]](11335_descent_rate_avg.svg)
![.png [900x900]](11335_descent_rate_v_pres.png)
![.svg [390x415]](11335_descent_rate_v_pres_small.svg)
![.svg [900x900]](11335_descent_rate_v_pres.svg)
![.png [900x900]](11335_descent_rate_v_time.png)
![.svg [390x415]](11335_descent_rate_v_time_small.svg)
![.svg [900x900]](11335_descent_rate_v_time.svg)
![.png [1600x900]](11335_descent_sample_count.png)
![.svg [780x215]](11335_descent_sample_count_small.svg)
![.svg [1600x900]](11335_descent_sample_count.svg)
![.png [390x415]](11335_displacement_submerged_small.png)
![.png [900x900]](11335_displacement_submerged.png)
![.svg [390x415]](11335_displacement_submerged_small.svg)
![.svg [900x900]](11335_displacement_submerged.svg)
![.png [900x900]](11335_displacement_submerged_velocity.png)
![.svg [390x415]](11335_displacement_submerged_velocity_small.svg)
![.svg [900x900]](11335_displacement_submerged_velocity.svg)
![.png [390x415]](11335_displacement_surface_small.png)
![.png [900x900]](11335_displacement_surface.png)
![.svg [390x415]](11335_displacement_surface_small.svg)
![.svg [900x900]](11335_displacement_surface.svg)
![.png [900x900]](11335_displacement_surface_velocity.png)
![.svg [390x415]](11335_displacement_surface_velocity_small.svg)
![.svg [900x900]](11335_displacement_surface_velocity.svg)
![.png [900x900]](11335_drift_dens.png)
![.svg [390x415]](11335_drift_dens_small.svg)
![.svg [900x900]](11335_drift_dens.svg)
![.png [900x900]](11335_drift_dens_avg.png)
![.svg [390x415]](11335_drift_dens_avg_small.svg)
![.svg [900x900]](11335_drift_dens_avg.svg)
![.png [900x900]](11335_drift_pres.png)
![.svg [390x415]](11335_drift_pres_small.svg)
![.svg [900x900]](11335_drift_pres.svg)
![.png [900x900]](11335_drift_pres_avg.png)
![.svg [390x415]](11335_drift_pres_avg_small.svg)
![.svg [900x900]](11335_drift_pres_avg.svg)
![.png [900x900]](11335_drift_saln.png)
![.svg [390x415]](11335_drift_saln_small.svg)
![.svg [900x900]](11335_drift_saln.svg)
![.png [900x900]](11335_drift_saln_avg.png)
![.svg [390x415]](11335_drift_saln_avg_small.svg)
![.svg [900x900]](11335_drift_saln_avg.svg)
![.png [1600x900]](11335_drift_sample_count.png)
![.svg [780x215]](11335_drift_sample_count_small.svg)
![.svg [1600x900]](11335_drift_sample_count.svg)
![.png [390x415]](11335_drift_sigma0_small.png)
![.png [900x900]](11335_drift_sigma0.png)
![.svg [390x415]](11335_drift_sigma0_small.svg)
![.svg [900x900]](11335_drift_sigma0.svg)
![.png [390x415]](11335_drift_sigma0_avg_small.png)
![.png [900x900]](11335_drift_sigma0_avg.png)
![.svg [390x415]](11335_drift_sigma0_avg_small.svg)
![.svg [900x900]](11335_drift_sigma0_avg.svg)
![.png [900x900]](11335_drift_temp.png)
![.svg [390x415]](11335_drift_temp_small.svg)
![.svg [900x900]](11335_drift_temp.svg)
![.png [900x900]](11335_drift_temp_avg.png)
![.svg [390x415]](11335_drift_temp_avg_small.svg)
![.svg [900x900]](11335_drift_temp_avg.svg)
![.png [900x900]](11335_position.png)
![.svg [390x415]](11335_position_small.svg)
![.svg [900x900]](11335_position.svg)
![.png [390x415]](11335_position_all_small.png)
![.png [900x900]](11335_position_all.png)
![.svg [390x415]](11335_position_all_small.svg)
![.svg [900x900]](11335_position_all.svg)
![.png [900x900]](11335_position_globe.png)
![.svg [390x415]](11335_position_globe_small.svg)
![.svg [900x900]](11335_position_globe.svg)
![.png [900x900]](11335_position_gps.png)
![.svg [390x415]](11335_position_gps_small.svg)
![.svg [900x900]](11335_position_gps.svg)
![.png [780x615]](11335_profile_contour_dens_small.png)
![.png [1600x900]](11335_profile_contour_dens.png)
![.svg [780x615]](11335_profile_contour_dens_small.svg)
![.svg [1600x900]](11335_profile_contour_dens.svg)
![.png [1600x900]](11335_profile_contour_saln.png)
![.svg [780x615]](11335_profile_contour_saln_small.svg)
![.svg [1600x900]](11335_profile_contour_saln.svg)
![.png [1600x900]](11335_profile_contour_sigma0.png)
![.svg [780x615]](11335_profile_contour_sigma0_small.svg)
![.svg [1600x900]](11335_profile_contour_sigma0.svg)
![.png [1600x900]](11335_profile_contour_temp.png)
![.svg [780x615]](11335_profile_contour_temp_small.svg)
![.svg [1600x900]](11335_profile_contour_temp.svg)
![.png [390x415]](11335_profile_dens_small.png)
![.png [900x900]](11335_profile_dens.png)
![.svg [390x415]](11335_profile_dens_small.svg)
![.svg [900x900]](11335_profile_dens.svg)
![.png [1600x900]](11335_profile_num_bins.png)
![.svg [780x215]](11335_profile_num_bins_small.svg)
![.svg [1600x900]](11335_profile_num_bins.svg)
![.png [900x900]](11335_profile_saln.png)
![.svg [390x415]](11335_profile_saln_small.svg)
![.svg [900x900]](11335_profile_saln.svg)
![.png [900x900]](11335_profile_sigma0.png)
![.svg [390x415]](11335_profile_sigma0_small.svg)
![.svg [900x900]](11335_profile_sigma0.svg)
![.png [900x900]](11335_profile_temp.png)
![.svg [390x415]](11335_profile_temp_small.svg)
![.svg [900x900]](11335_profile_temp.svg)
![.png [900x900]](11335_profile_ts.png)
![.svg [390x415]](11335_profile_ts_small.svg)
![.svg [900x900]](11335_profile_ts.svg)
![.png [900x900]](11335_pump_curr.png)
![.svg [390x415]](11335_pump_curr_small.svg)
![.svg [900x900]](11335_pump_curr.svg)
![.png [900x900]](11335_pump_curr_avg.png)
![.svg [390x415]](11335_pump_curr_avg_small.svg)
![.svg [900x900]](11335_pump_curr_avg.svg)
![.png [900x900]](11335_pump_energy.png)
![.svg [390x415]](11335_pump_energy_small.svg)
![.svg [900x900]](11335_pump_energy.svg)
![.png [1600x900]](11335_pump_energy_sum.png)
![.svg [780x215]](11335_pump_energy_sum_small.svg)
![.svg [1600x900]](11335_pump_energy_sum.svg)
![.png [900x900]](11335_pump_energy_v_max_pres.png)
![.svg [390x415]](11335_pump_energy_v_max_pres_small.svg)
![.svg [900x900]](11335_pump_energy_v_max_pres.svg)
![.png [1600x900]](11335_pump_num_ops.png)
![.svg [780x215]](11335_pump_num_ops_small.svg)
![.svg [1600x900]](11335_pump_num_ops.svg)
![.png [390x415]](11335_pump_power_small.png)
![.png [900x900]](11335_pump_power.png)
![.svg [390x415]](11335_pump_power_small.svg)
![.svg [900x900]](11335_pump_power.svg)
![.png [390x415]](11335_pump_power_avg_small.png)
![.png [900x900]](11335_pump_power_avg.png)
![.svg [390x415]](11335_pump_power_avg_small.svg)
![.svg [900x900]](11335_pump_power_avg.svg)
![.png [900x900]](11335_pump_power_v_pres.png)
![.svg [390x415]](11335_pump_power_v_pres_small.svg)
![.svg [900x900]](11335_pump_power_v_pres.svg)
![.png [900x900]](11335_pump_pres.png)
![.svg [390x415]](11335_pump_pres_small.svg)
![.svg [900x900]](11335_pump_pres.svg)
![.png [1600x900]](11335_pump_time_sum.png)
![.svg [780x215]](11335_pump_time_sum_small.svg)
![.svg [1600x900]](11335_pump_time_sum.svg)
![.png [900x900]](11335_pump_vac.png)
![.svg [390x415]](11335_pump_vac_small.svg)
![.svg [900x900]](11335_pump_vac.svg)
![.png [900x900]](11335_pump_vac_avg.png)
![.svg [390x415]](11335_pump_vac_avg_small.svg)
![.svg [900x900]](11335_pump_vac_avg.svg)
![.png [900x900]](11335_pump_vac_v_pres.png)
![.svg [390x415]](11335_pump_vac_v_pres_small.svg)
![.svg [900x900]](11335_pump_vac_v_pres.svg)
![.png [900x900]](11335_pump_vac_v_time.png)
![.svg [390x415]](11335_pump_vac_v_time_small.svg)
![.svg [900x900]](11335_pump_vac_v_time.svg)
![.png [900x900]](11335_pump_volt.png)
![.svg [390x415]](11335_pump_volt_small.svg)
![.svg [900x900]](11335_pump_volt.svg)
![.png [900x900]](11335_pump_volt_avg.png)
![.svg [390x415]](11335_pump_volt_avg_small.svg)
![.svg [900x900]](11335_pump_volt_avg.svg)
![.png [1600x900]](11335_satcom.png)
![.svg [780x615]](11335_satcom_small.svg)
![.svg [1600x900]](11335_satcom.svg)
![.png [900x900]](11335_satcom_gps_cno.png)
![.svg [390x415]](11335_satcom_gps_cno_small.svg)
![.svg [900x900]](11335_satcom_gps_cno.svg)
![.png [900x900]](11335_satcom_gps_fix_cep.png)
![.svg [390x415]](11335_satcom_gps_fix_cep_small.svg)
![.svg [900x900]](11335_satcom_gps_fix_cep.svg)
![.png [900x900]](11335_satcom_gps_hdop.png)
![.svg [390x415]](11335_satcom_gps_hdop_small.svg)
![.svg [900x900]](11335_satcom_gps_hdop.svg)
![.png [900x900]](11335_satcom_gps_nsat.png)
![.svg [390x415]](11335_satcom_gps_nsat_small.svg)
![.svg [900x900]](11335_satcom_gps_nsat.svg)
![.png [900x900]](11335_satcom_gps_ttf.png)
![.svg [390x415]](11335_satcom_gps_ttf_small.svg)
![.svg [900x900]](11335_satcom_gps_ttf.svg)
![.png [900x900]](11335_satcom_iridium_fix_cep_avg.png)
![.svg [390x415]](11335_satcom_iridium_fix_cep_avg_small.svg)
![.svg [900x900]](11335_satcom_iridium_fix_cep_avg.svg)
![.png [1600x900]](11335_satcom_sbd_count.png)
![.svg [780x215]](11335_satcom_sbd_count_small.svg)
![.svg [1600x900]](11335_satcom_sbd_count.svg)
![.png [1600x900]](11335_satcom_sbd_data_size.png)
![.svg [780x215]](11335_satcom_sbd_data_size_small.svg)
![.svg [1600x900]](11335_satcom_sbd_data_size.svg)
![.png [900x900]](11335_satcom_sbd_data_size_avg.png)
![.svg [390x415]](11335_satcom_sbd_data_size_avg_small.svg)
![.svg [900x900]](11335_satcom_sbd_data_size_avg.svg)
![.png [900x900]](11335_surface_pres.png)
![.svg [390x415]](11335_surface_pres_small.svg)
![.svg [900x900]](11335_surface_pres.svg)
![.png [900x900]](11335_surface_pres_avg.png)
![.svg [390x415]](11335_surface_pres_avg_small.svg)
![.svg [900x900]](11335_surface_pres_avg.svg)
![.png [1600x900]](11335_surface_sample_count.png)
![.svg [780x215]](11335_surface_sample_count_small.svg)
![.svg [1600x900]](11335_surface_sample_count.svg)
![.png [900x900]](11335_surface_temp.png)
![.svg [390x415]](11335_surface_temp_small.svg)
![.svg [900x900]](11335_surface_temp.svg)
![.png [900x900]](11335_surface_temp_avg.png)
![.svg [390x415]](11335_surface_temp_avg_small.svg)
![.svg [900x900]](11335_surface_temp_avg.svg)
![.png [1600x900]](11335_trajectory.png)
![.svg [780x515]](11335_trajectory_small.svg)
![.svg [1600x900]](11335_trajectory.svg)