Interpolate across GPS gaps
Interpolate across GPS gaps
|
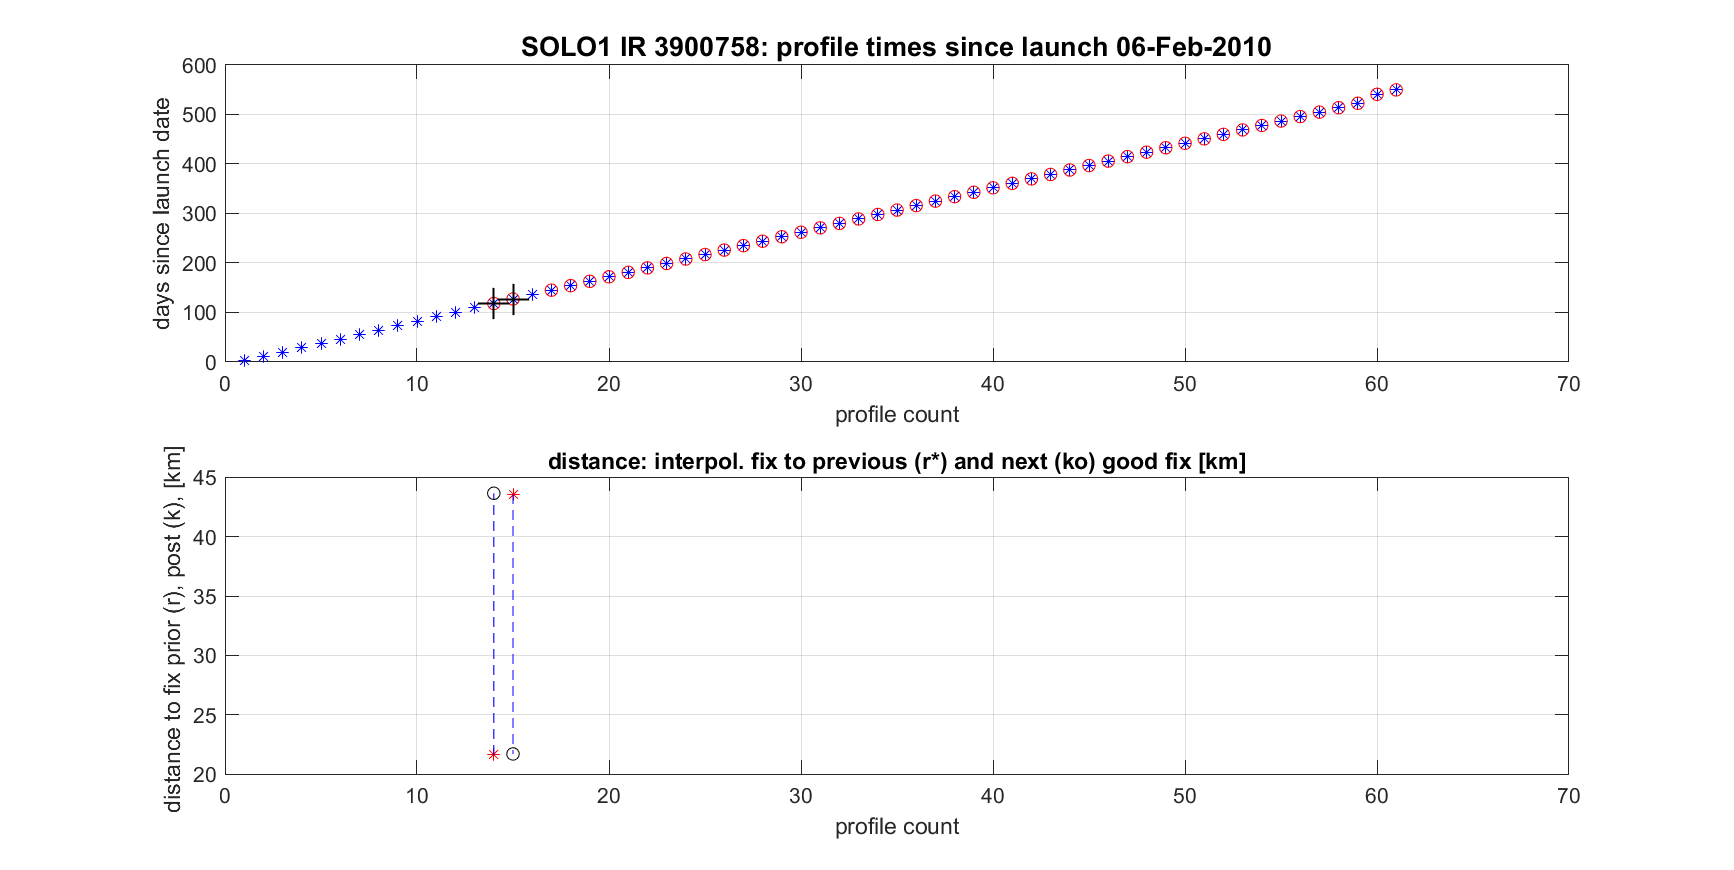
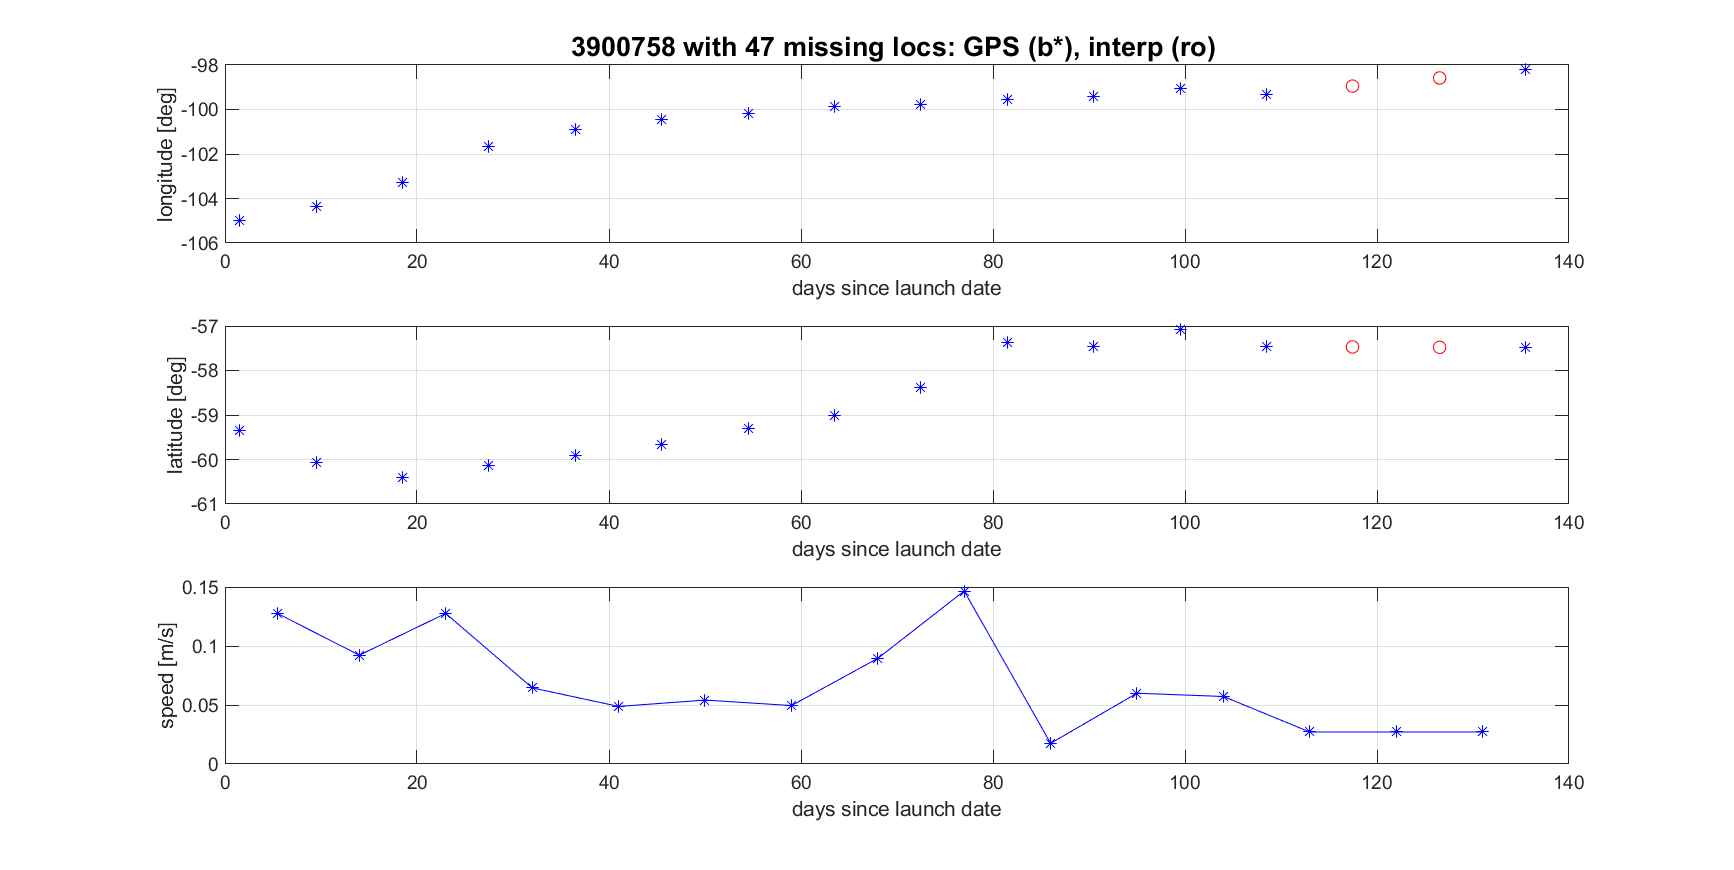
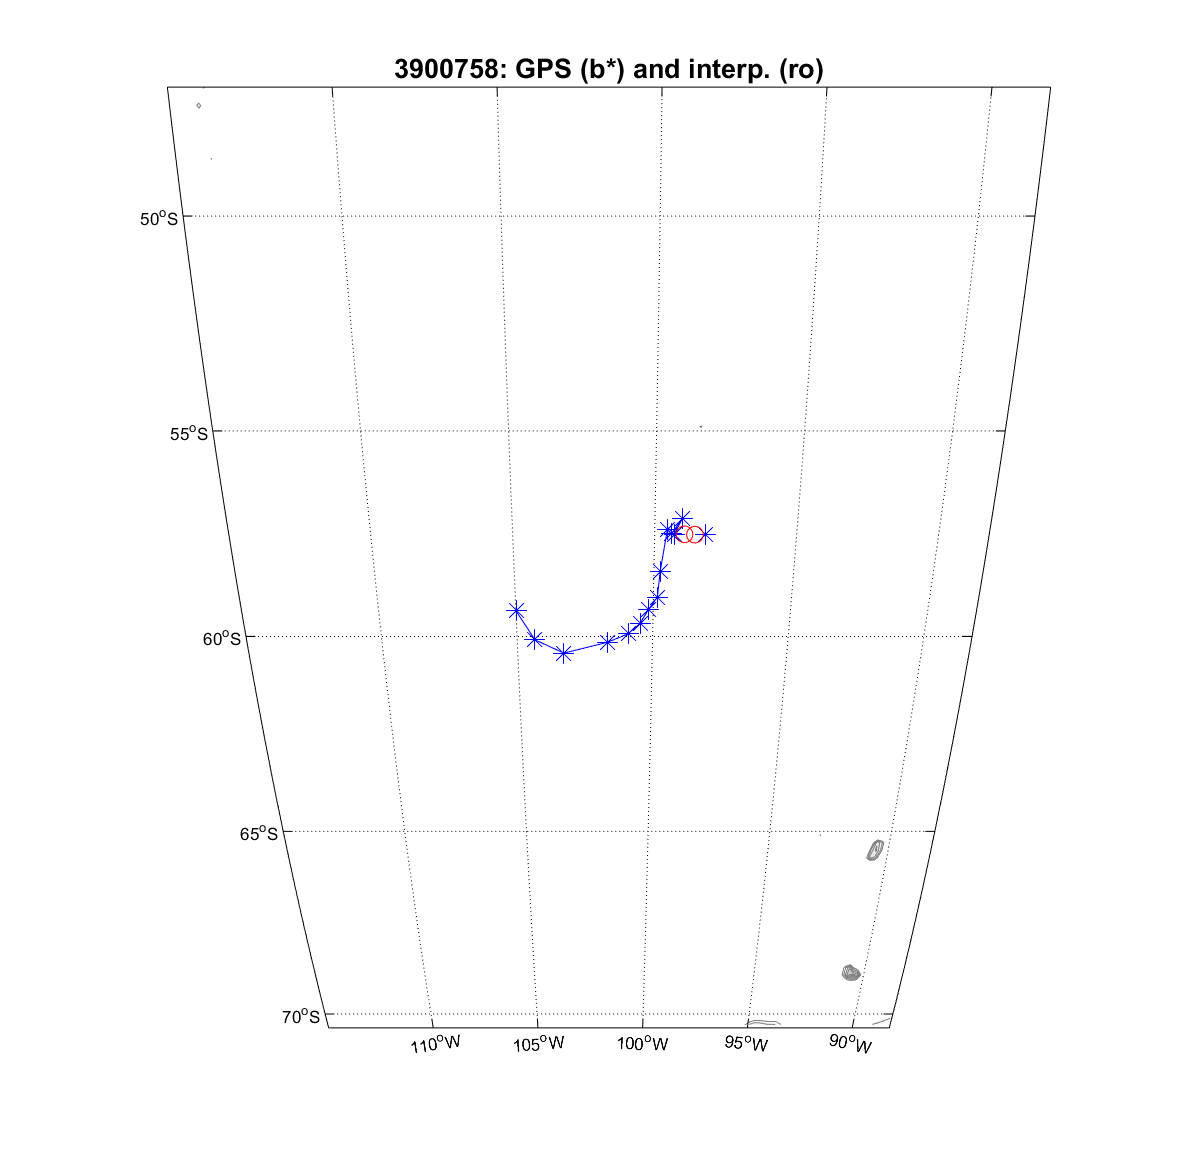
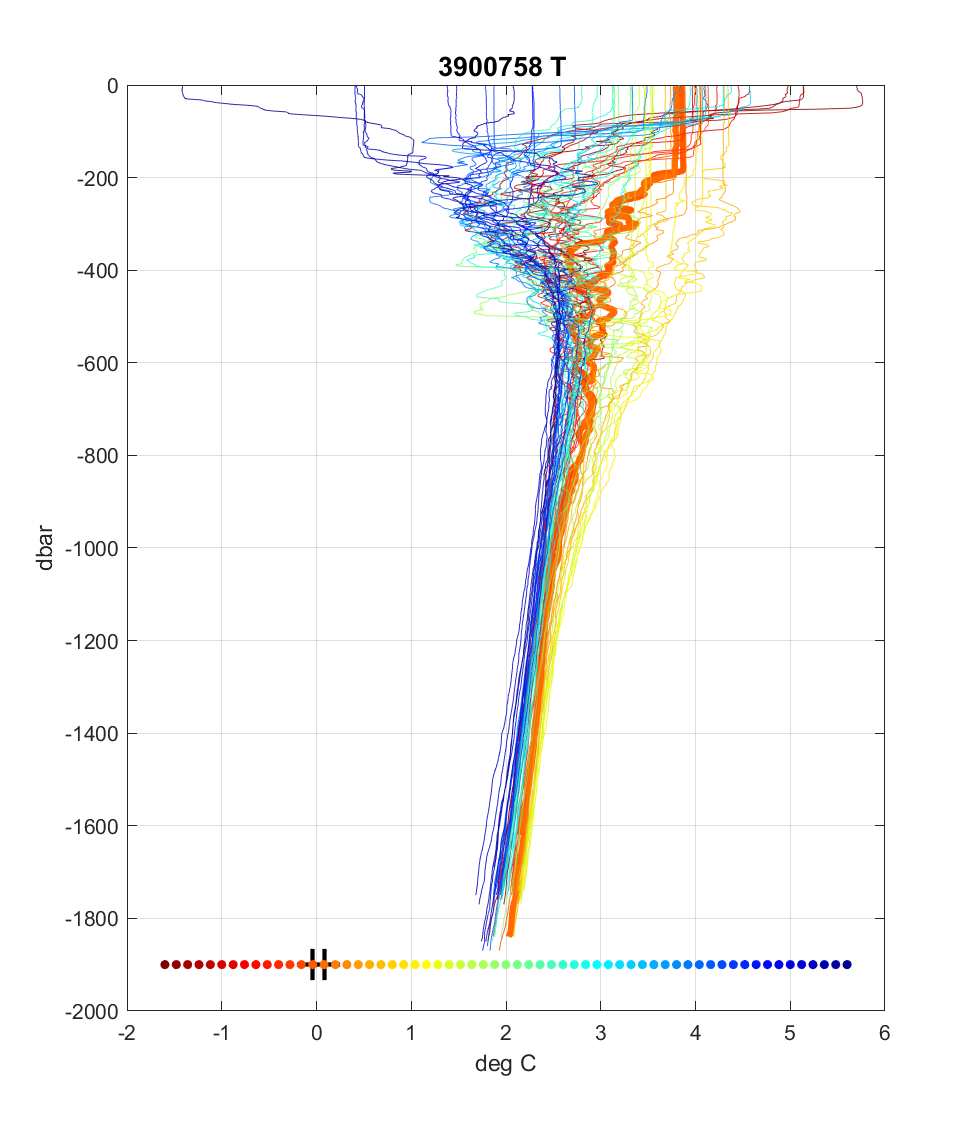
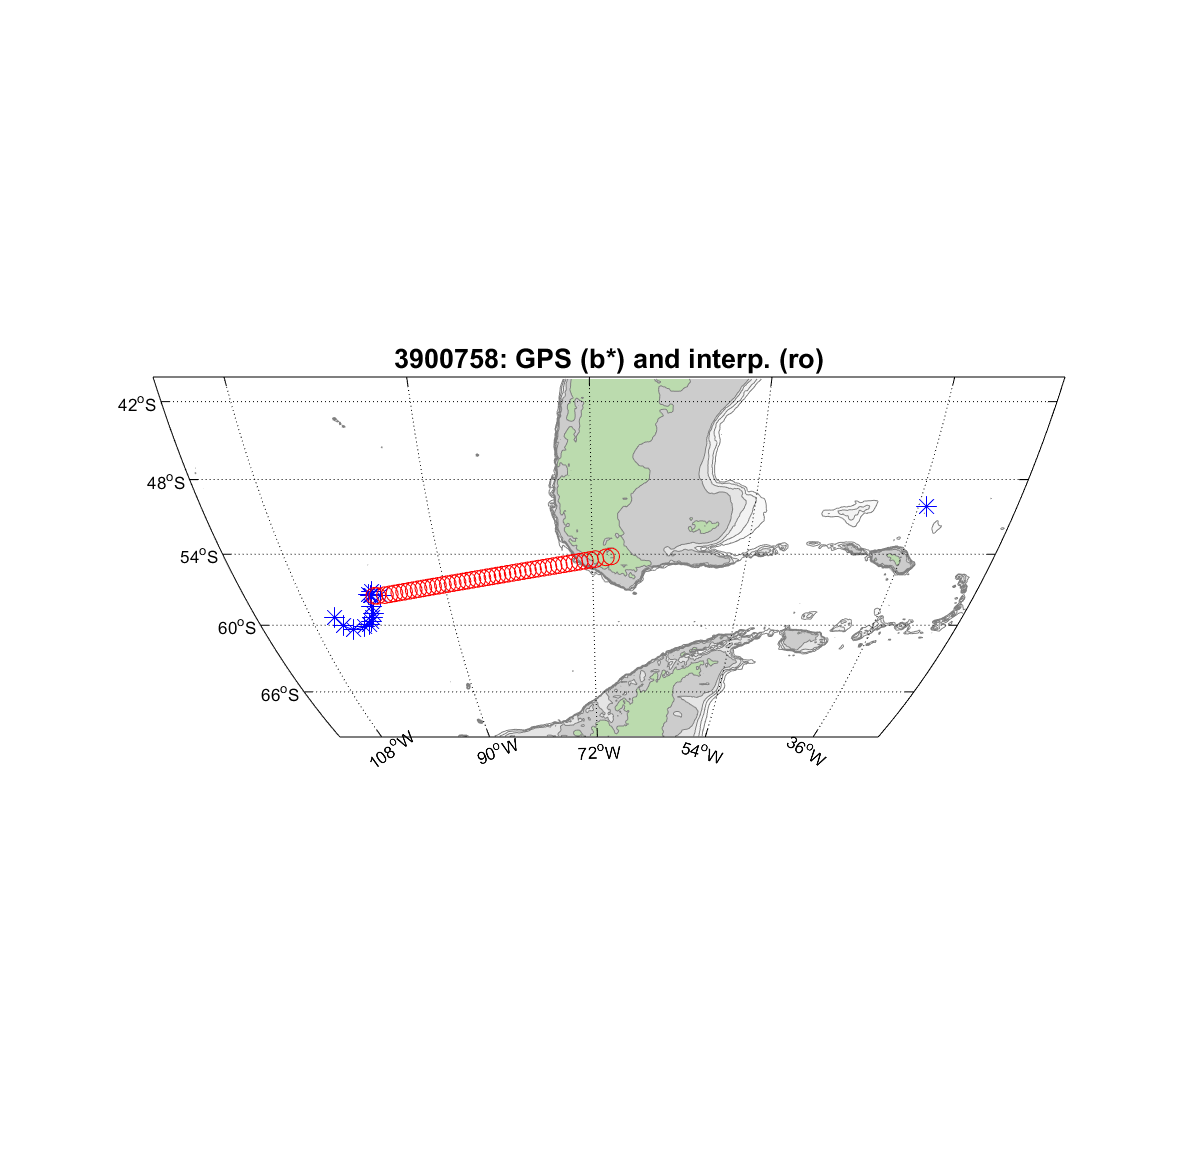
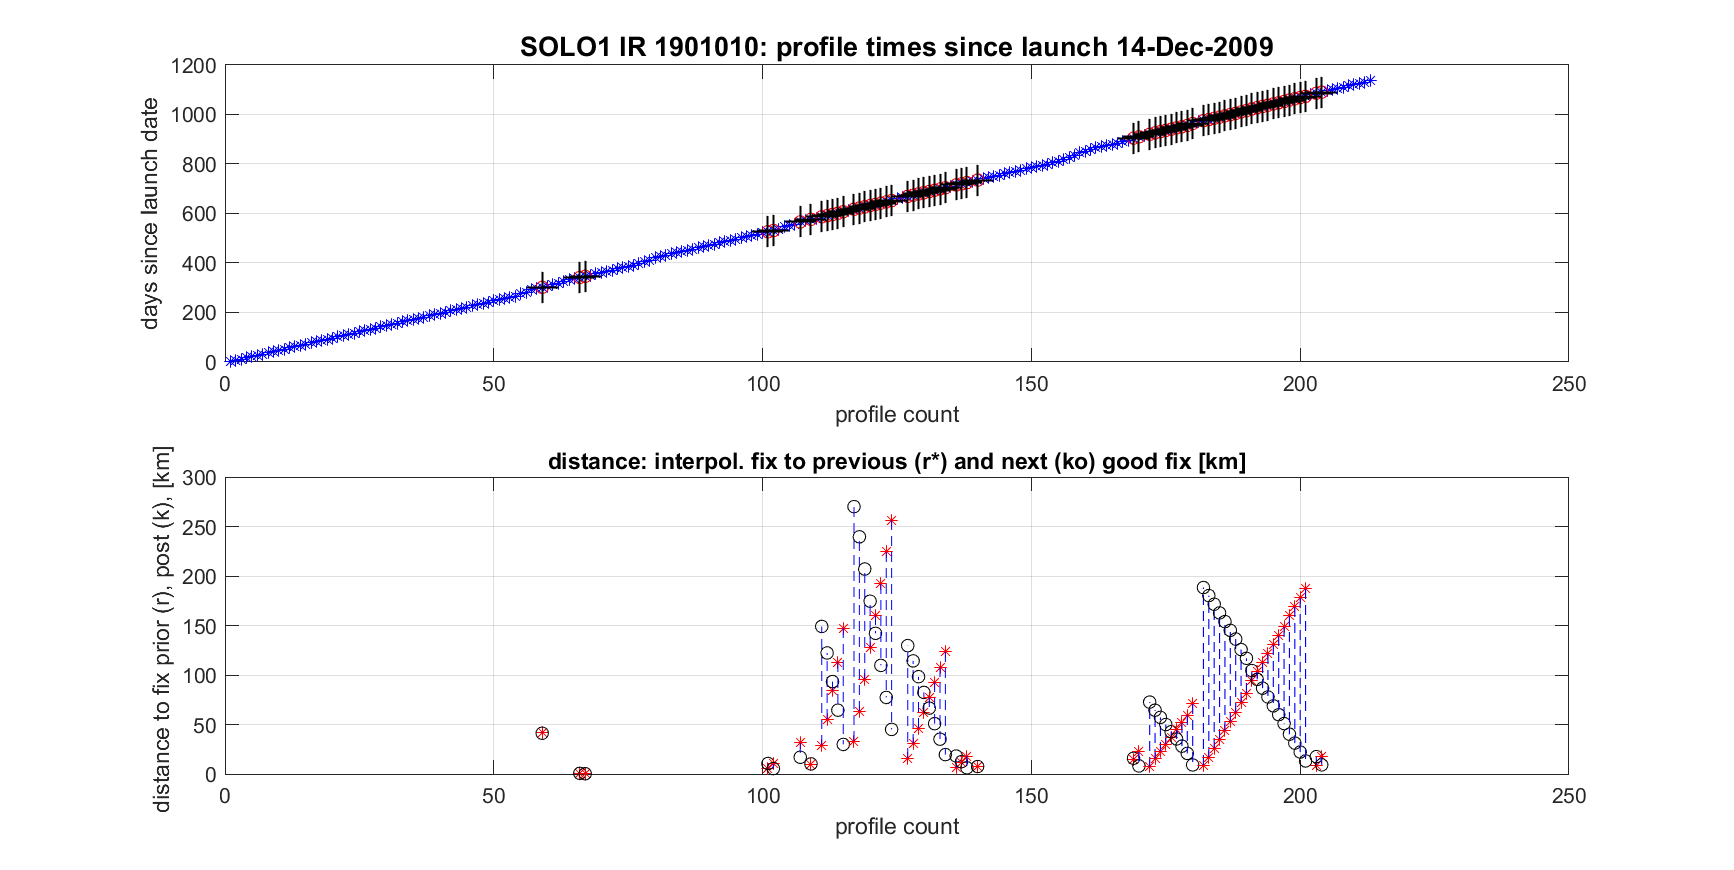
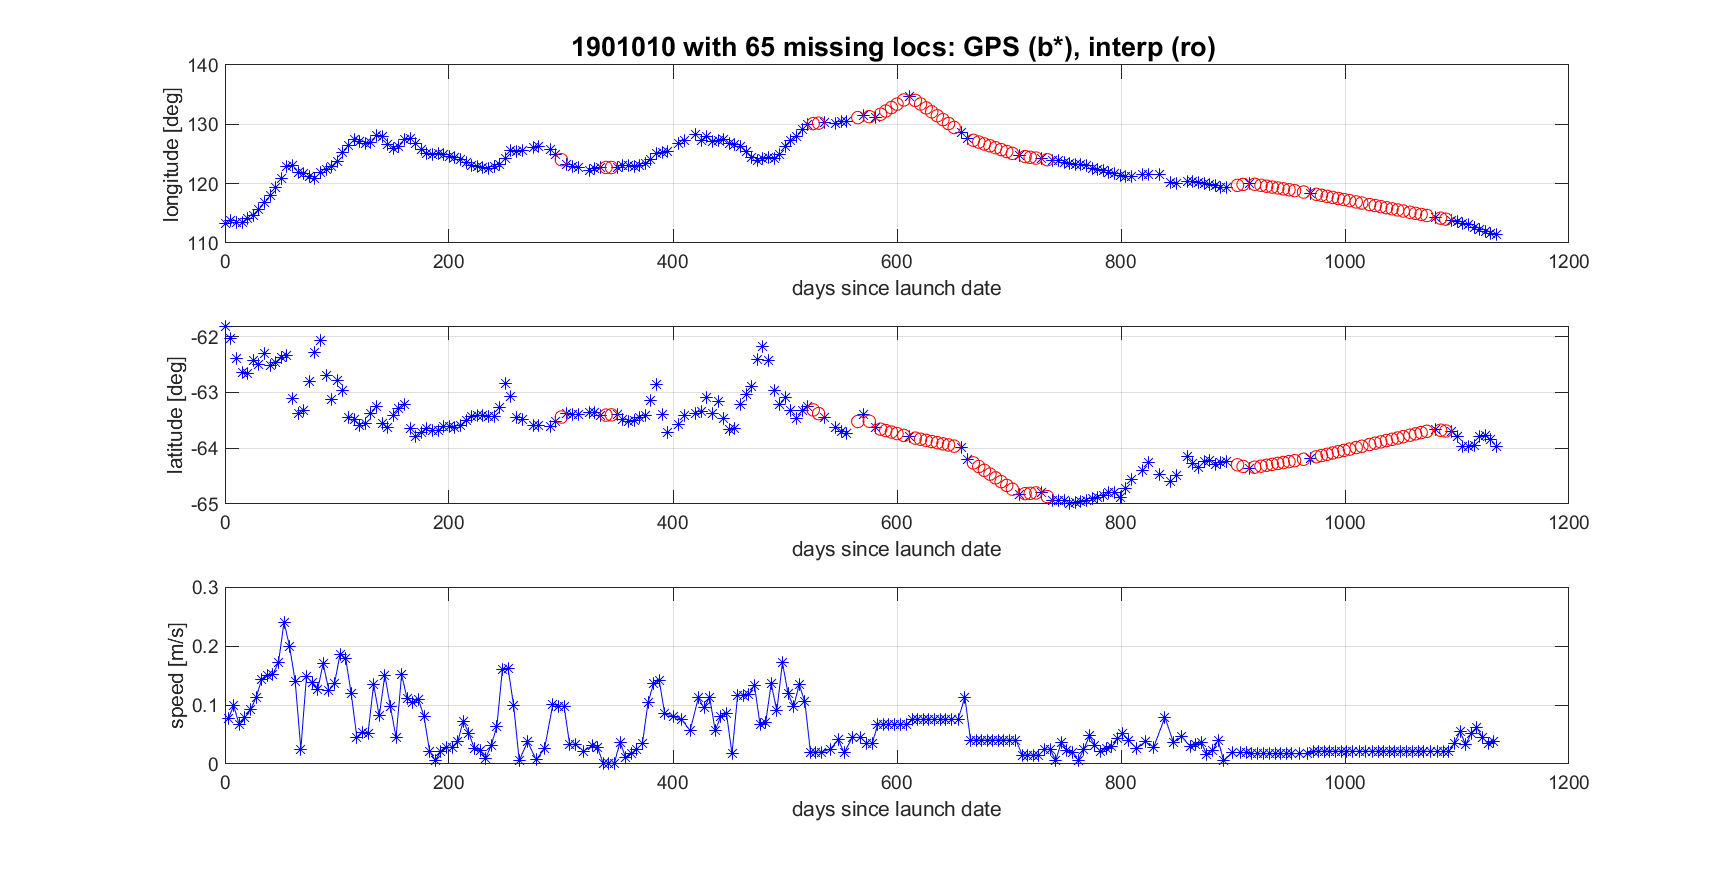
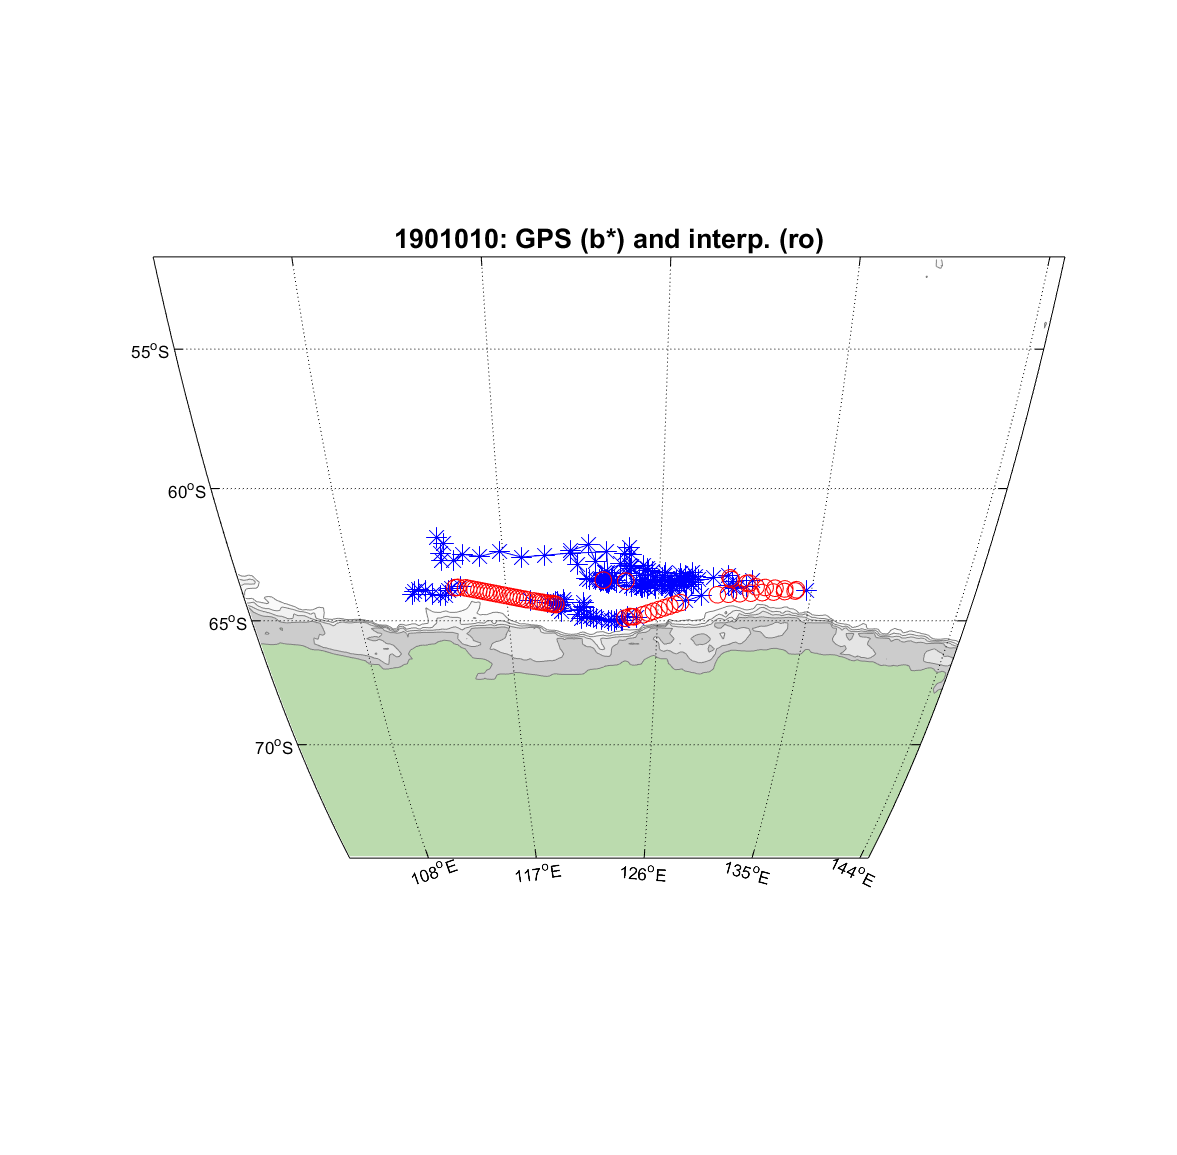
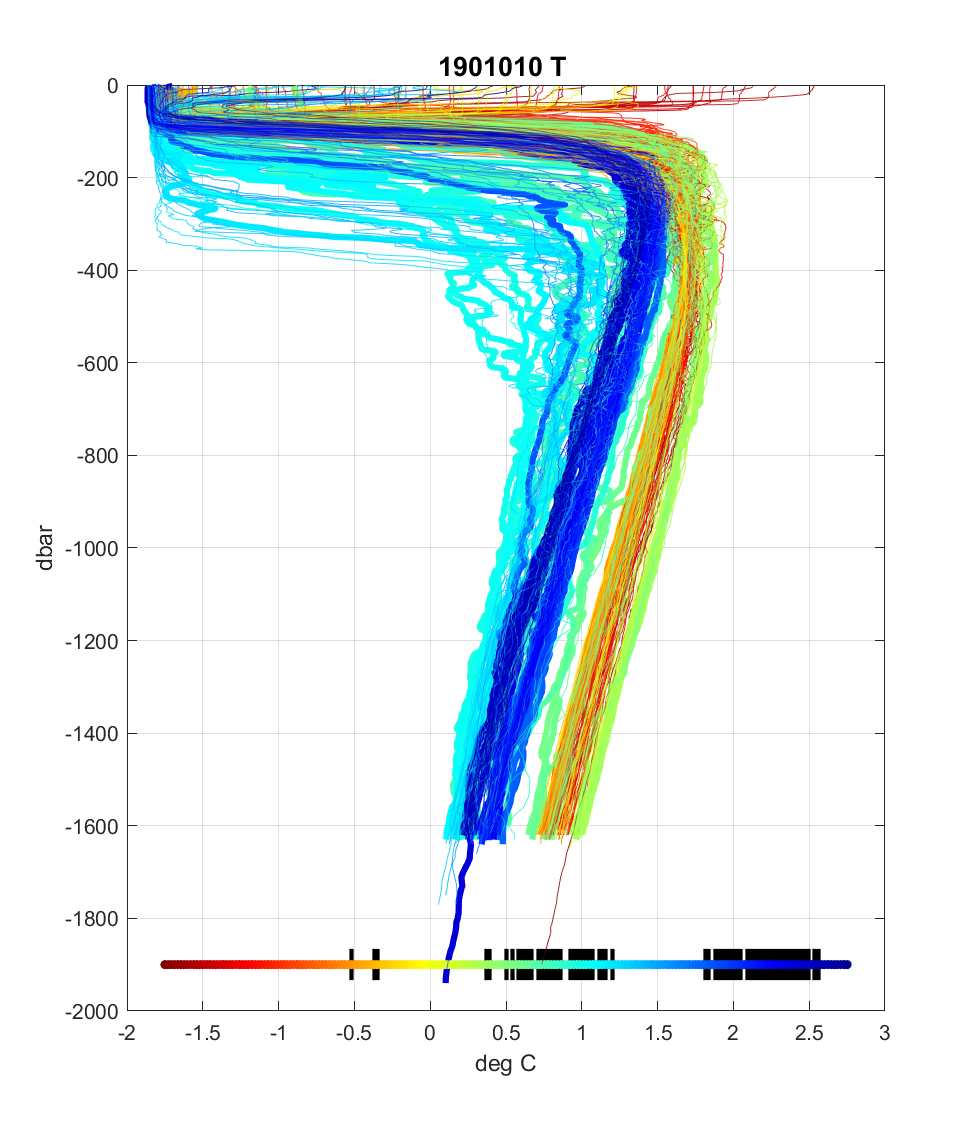
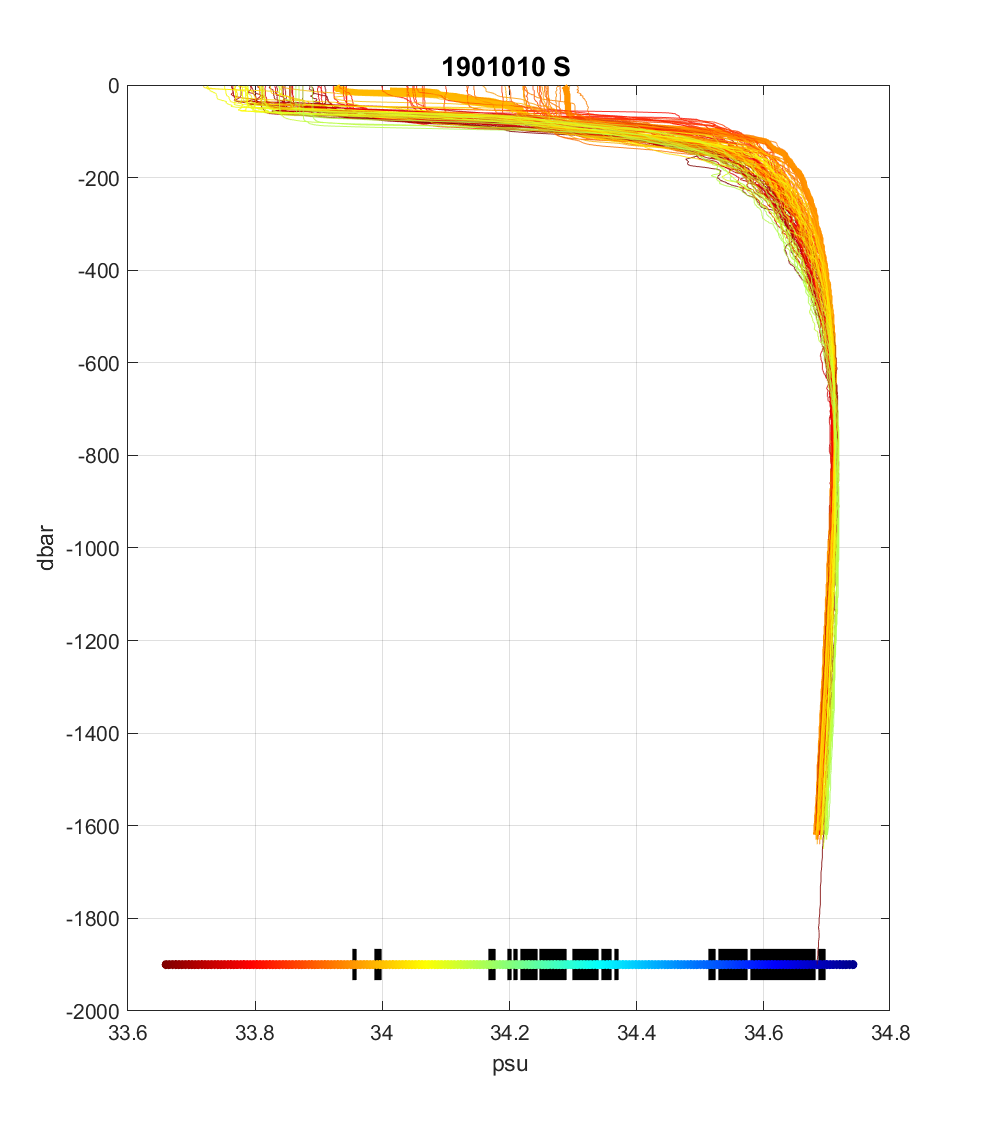
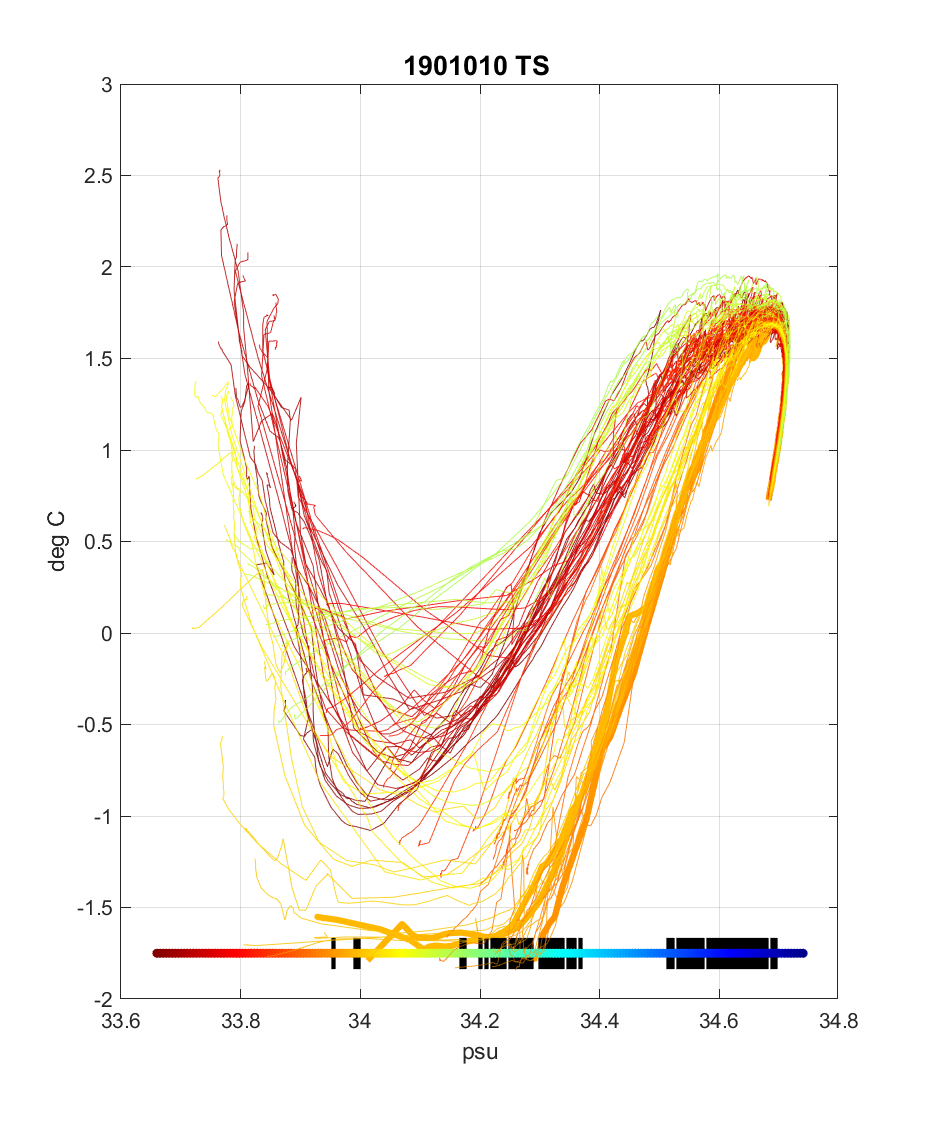
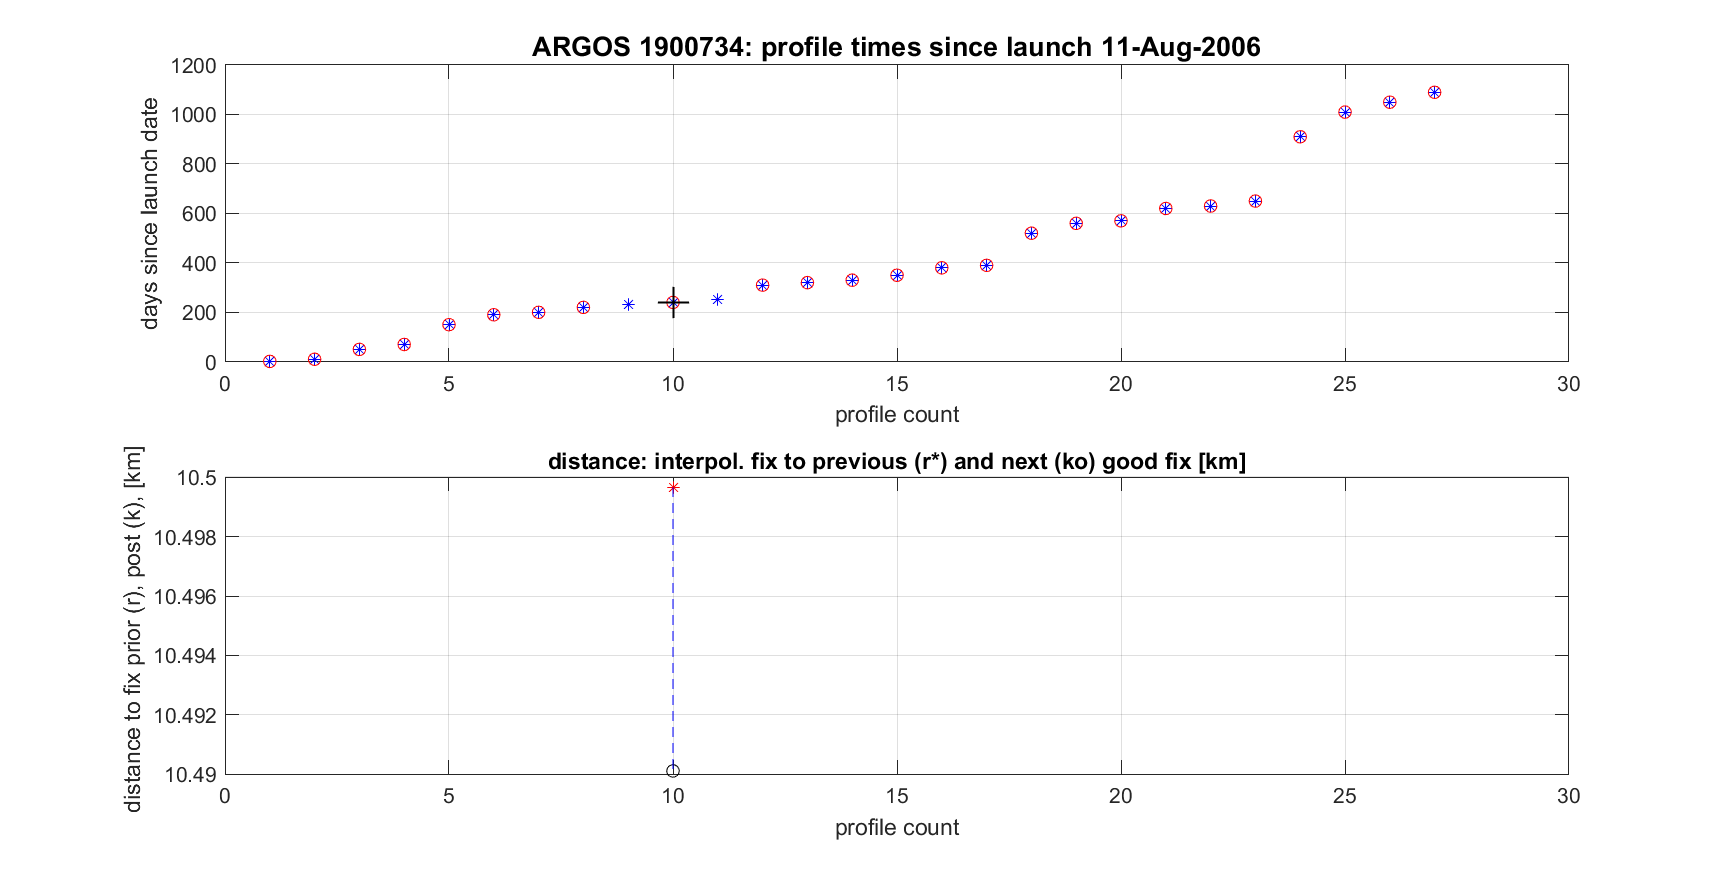
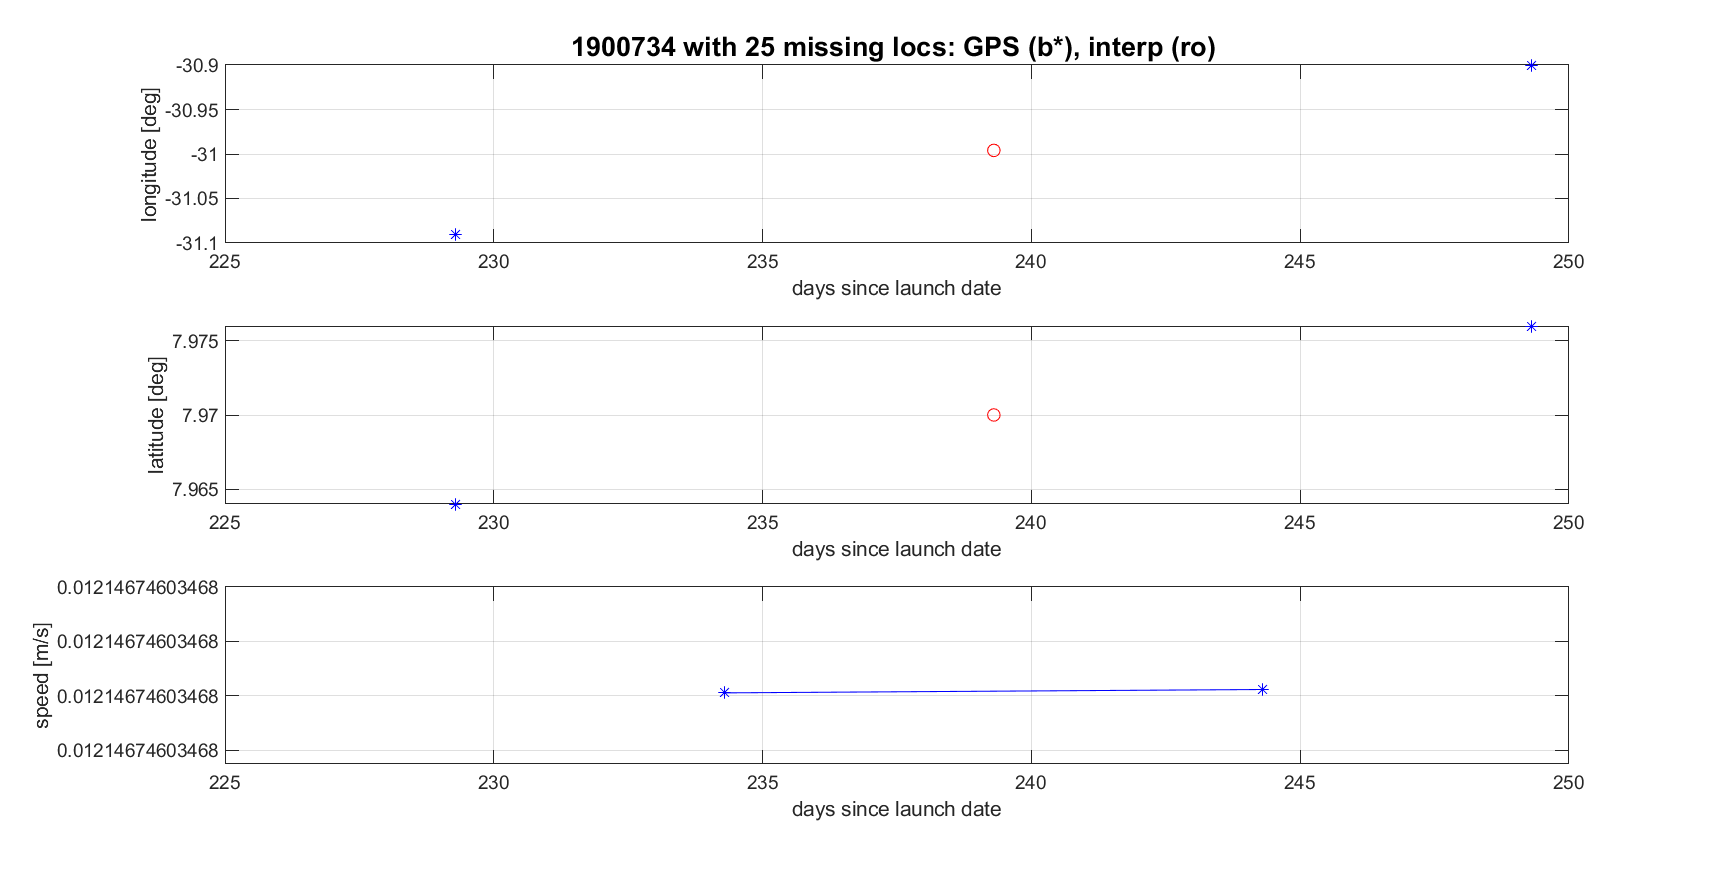
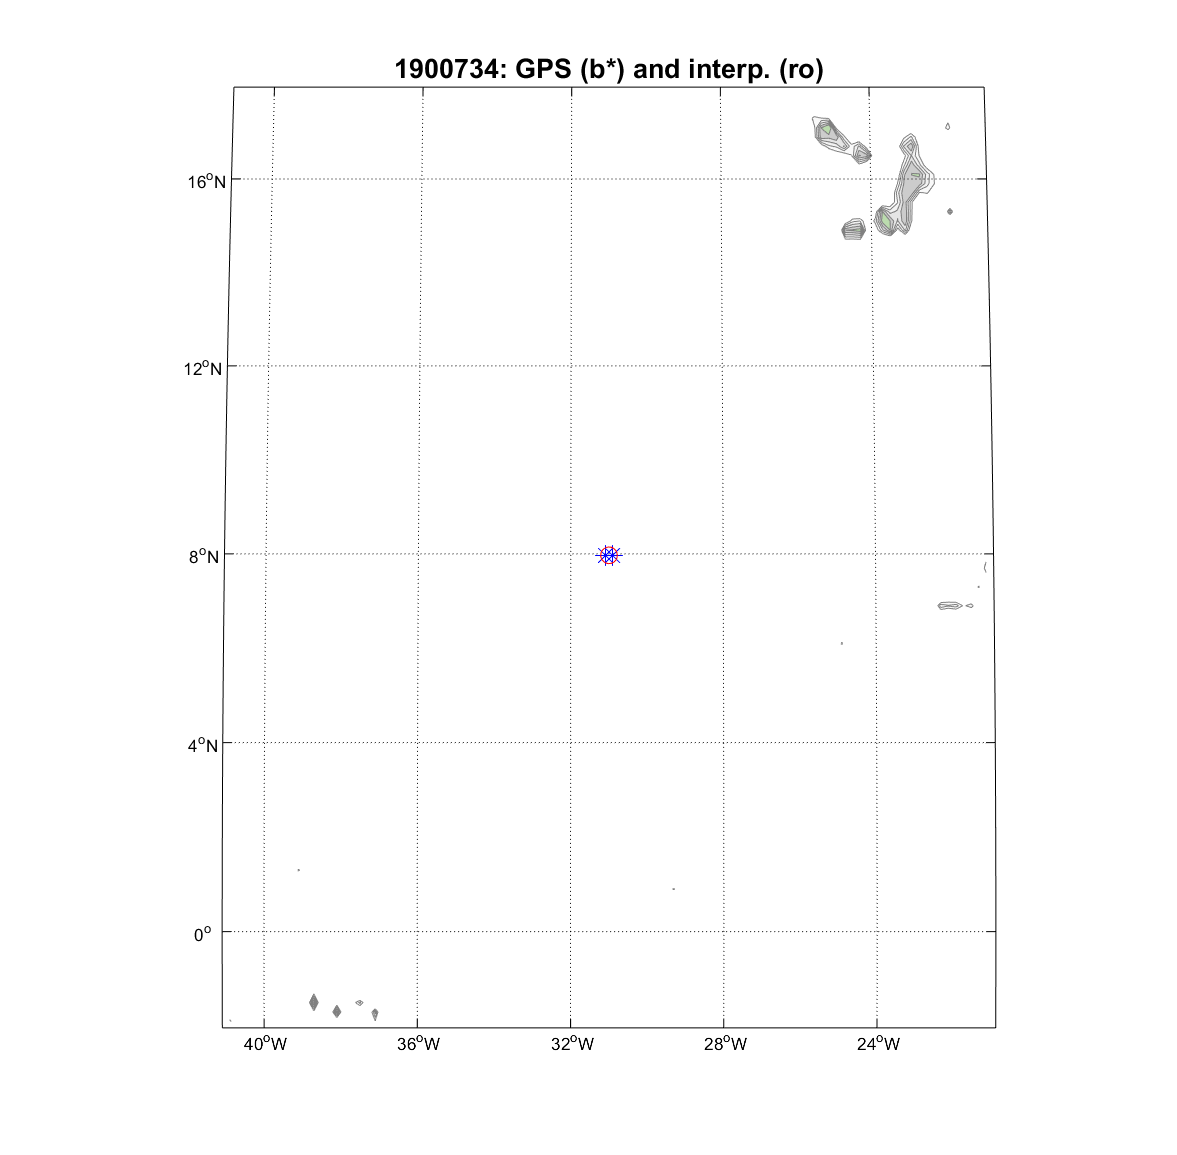
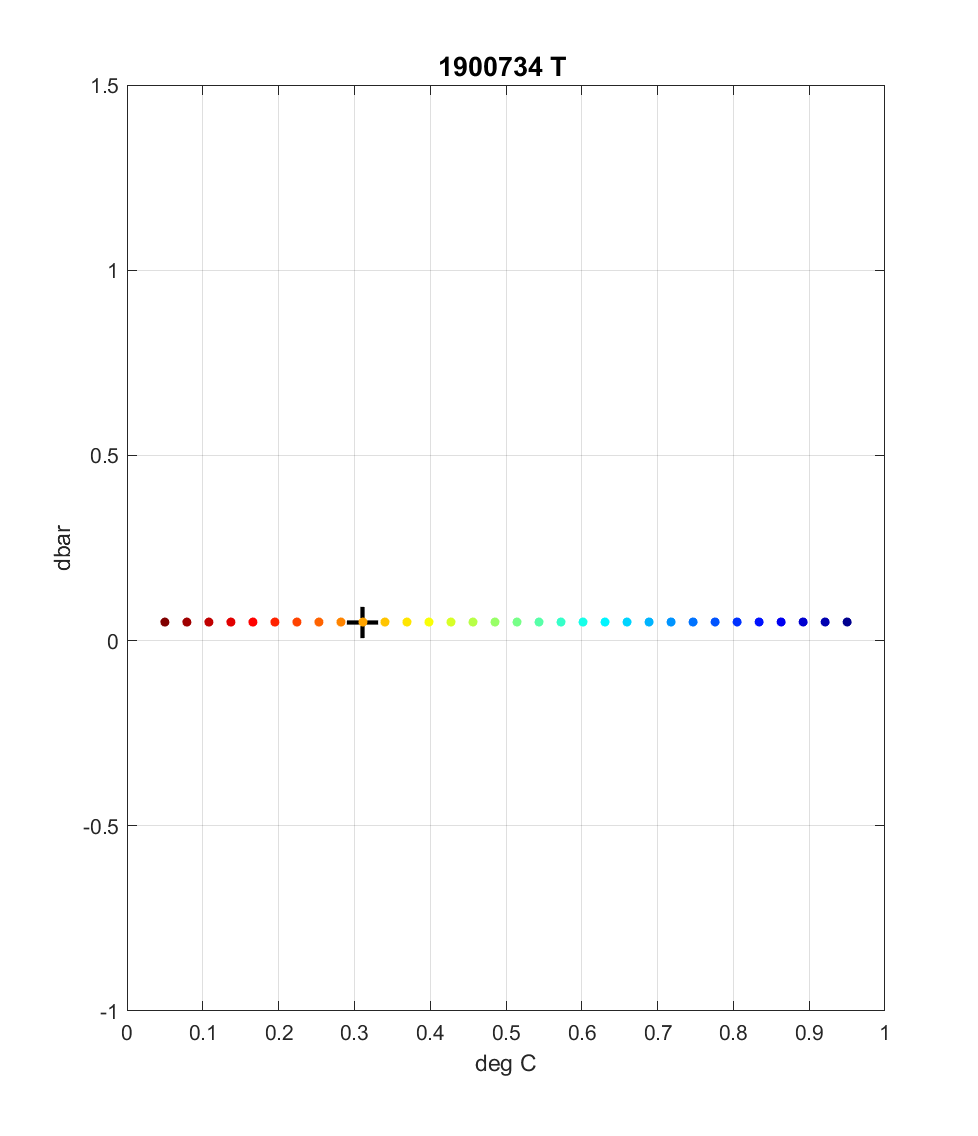
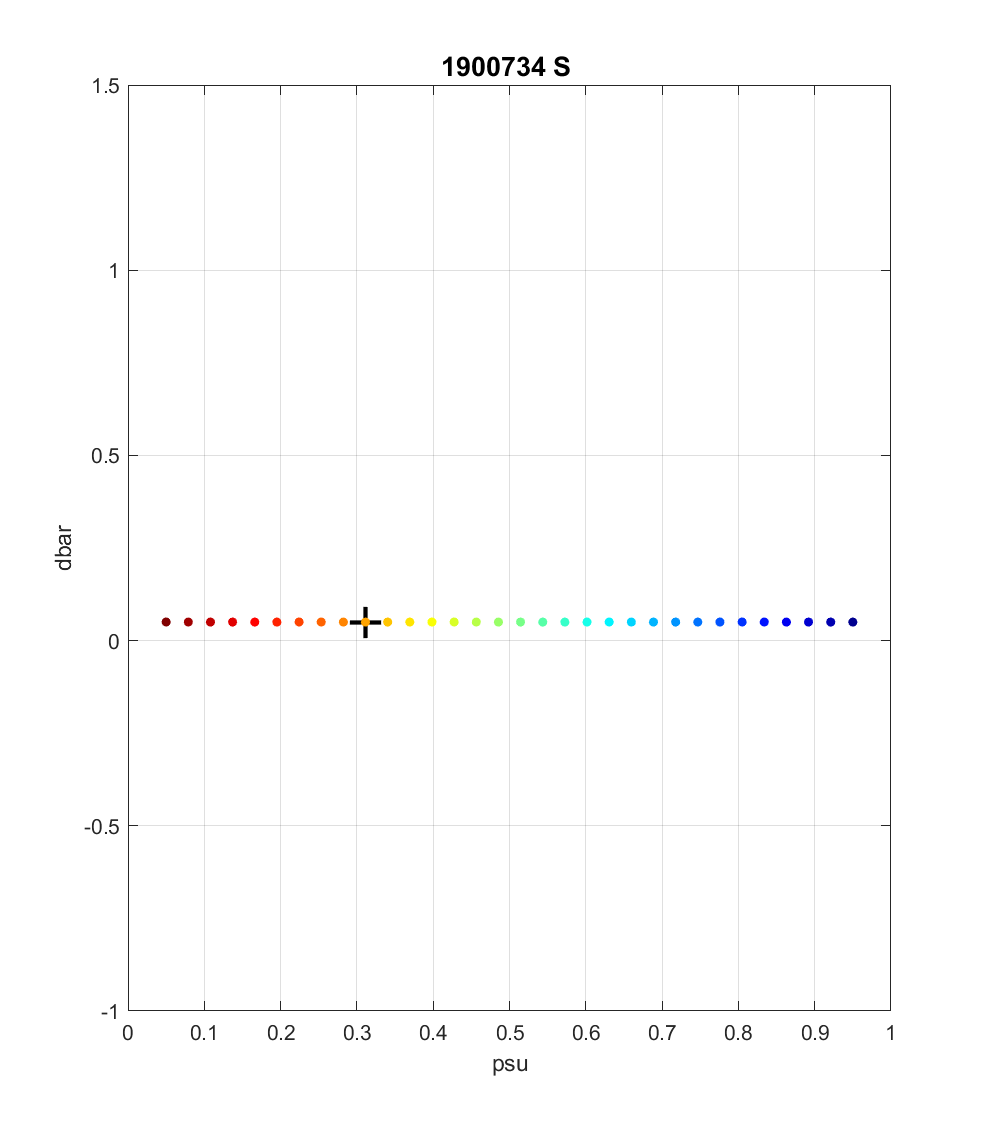
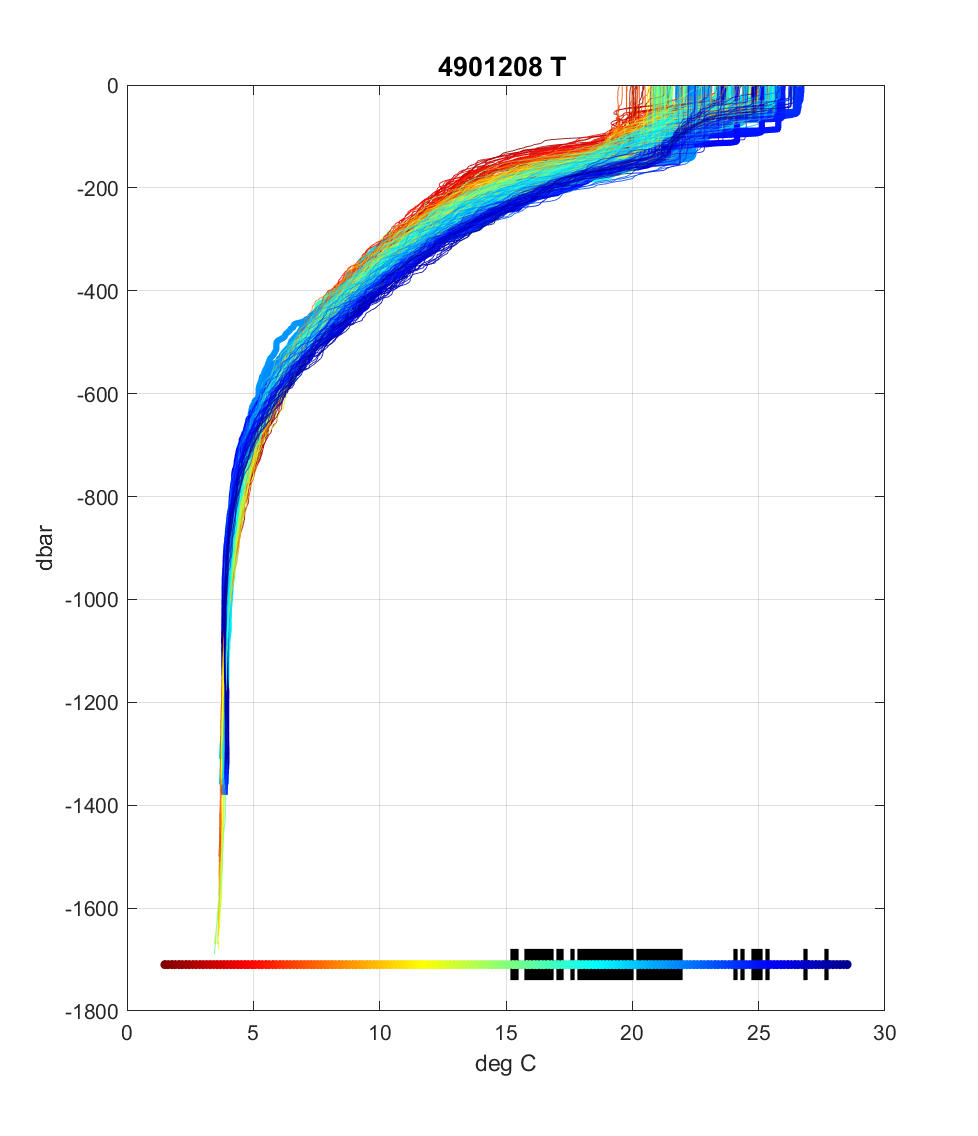
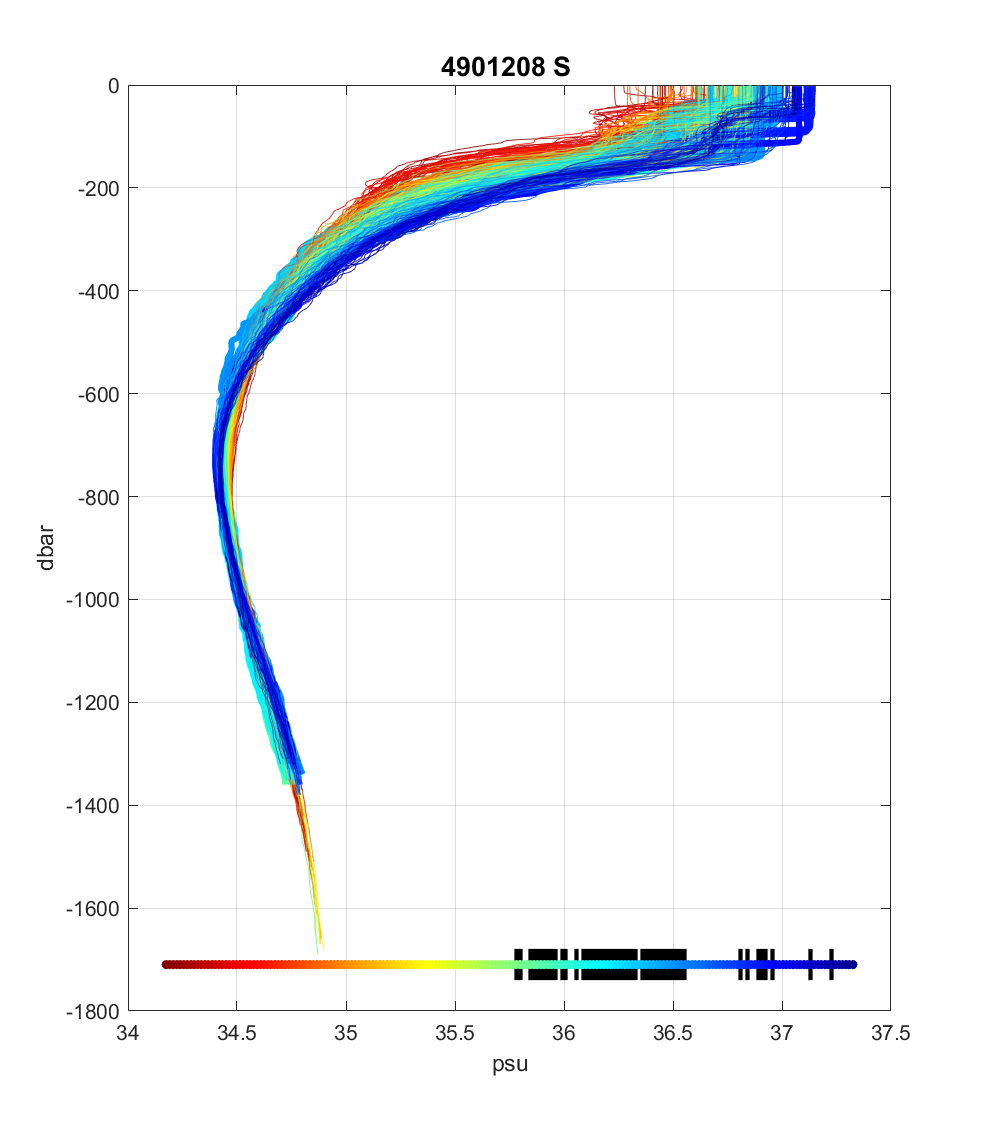
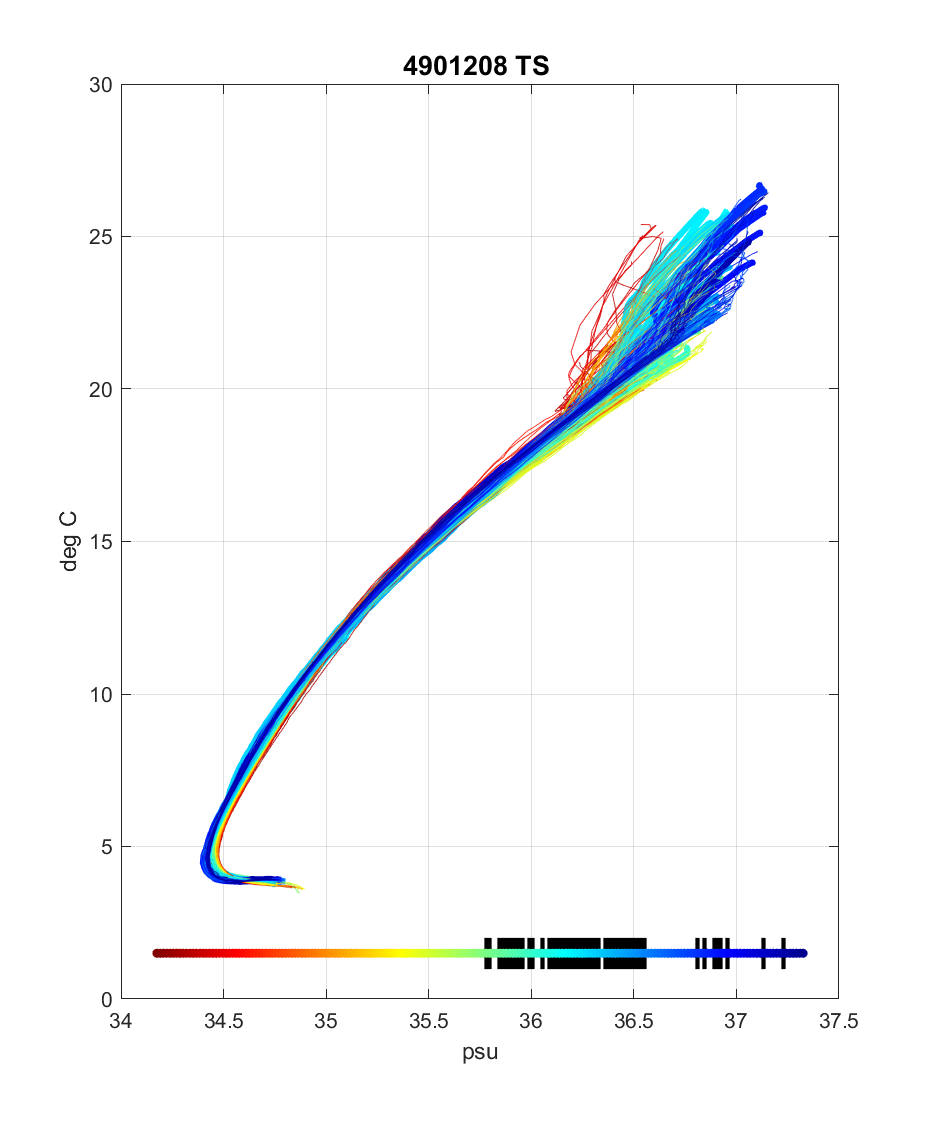
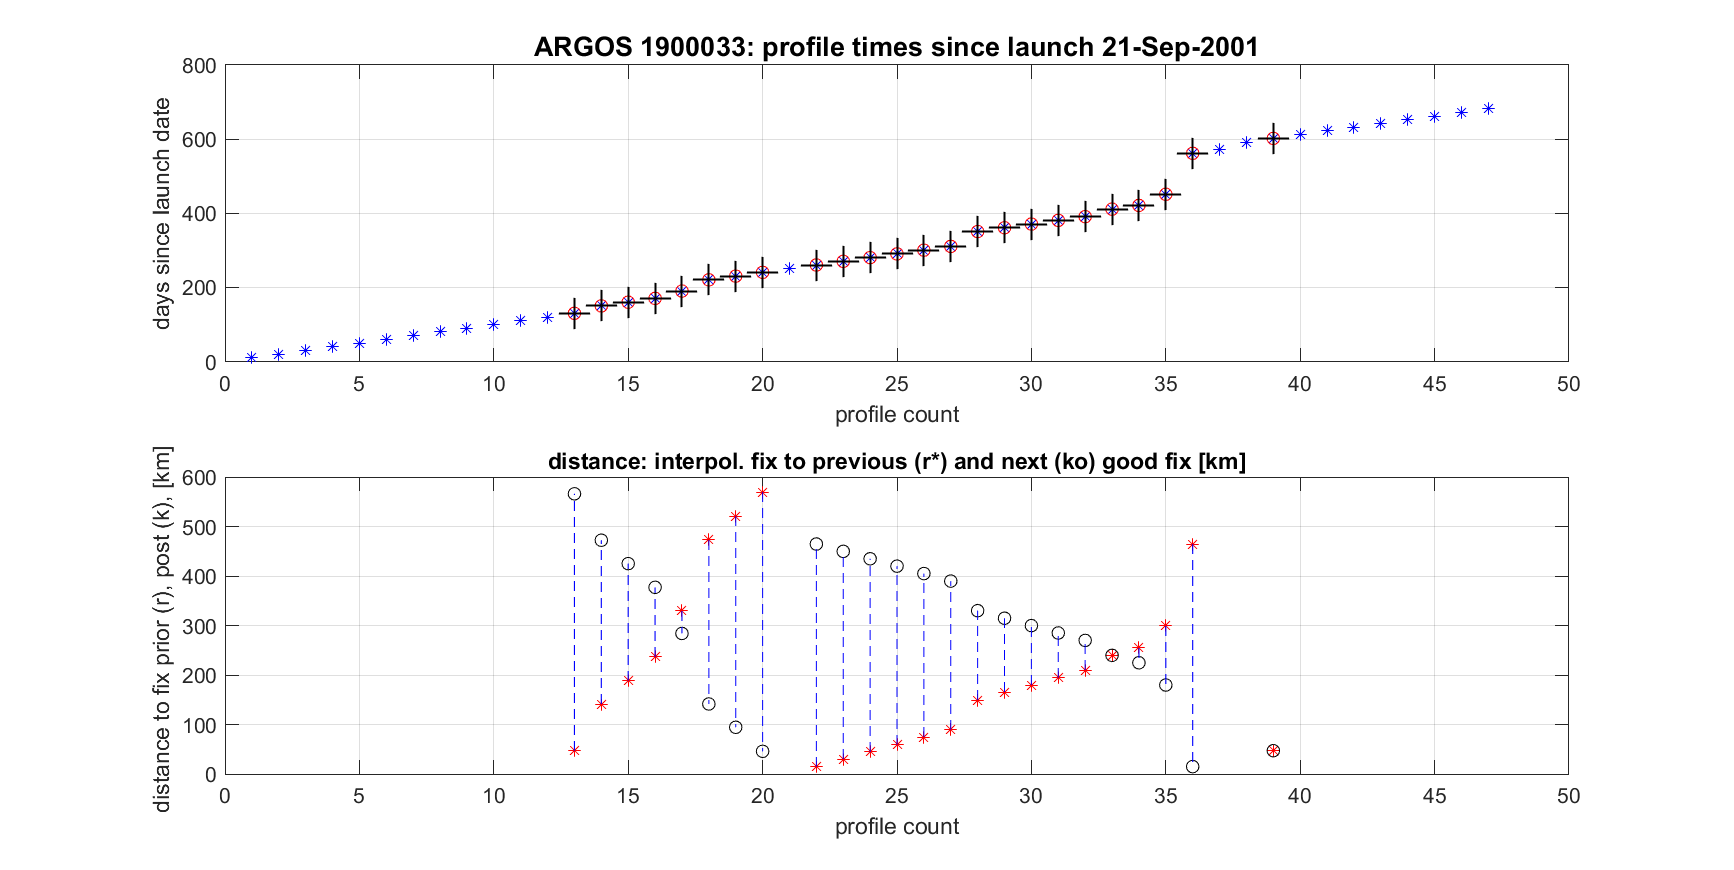
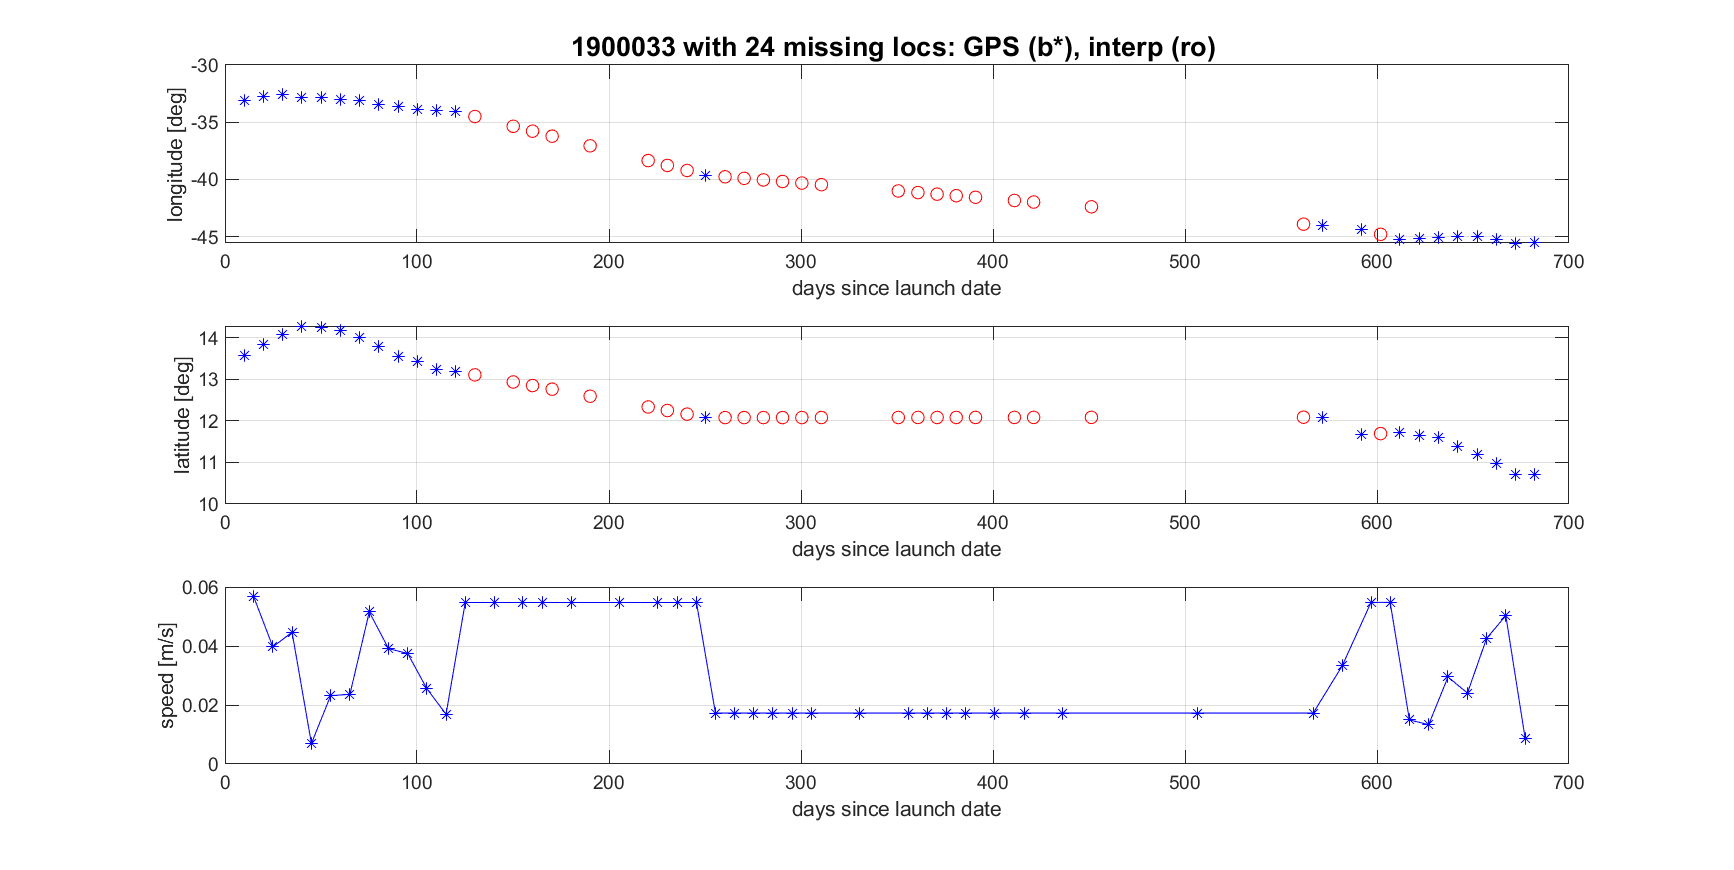
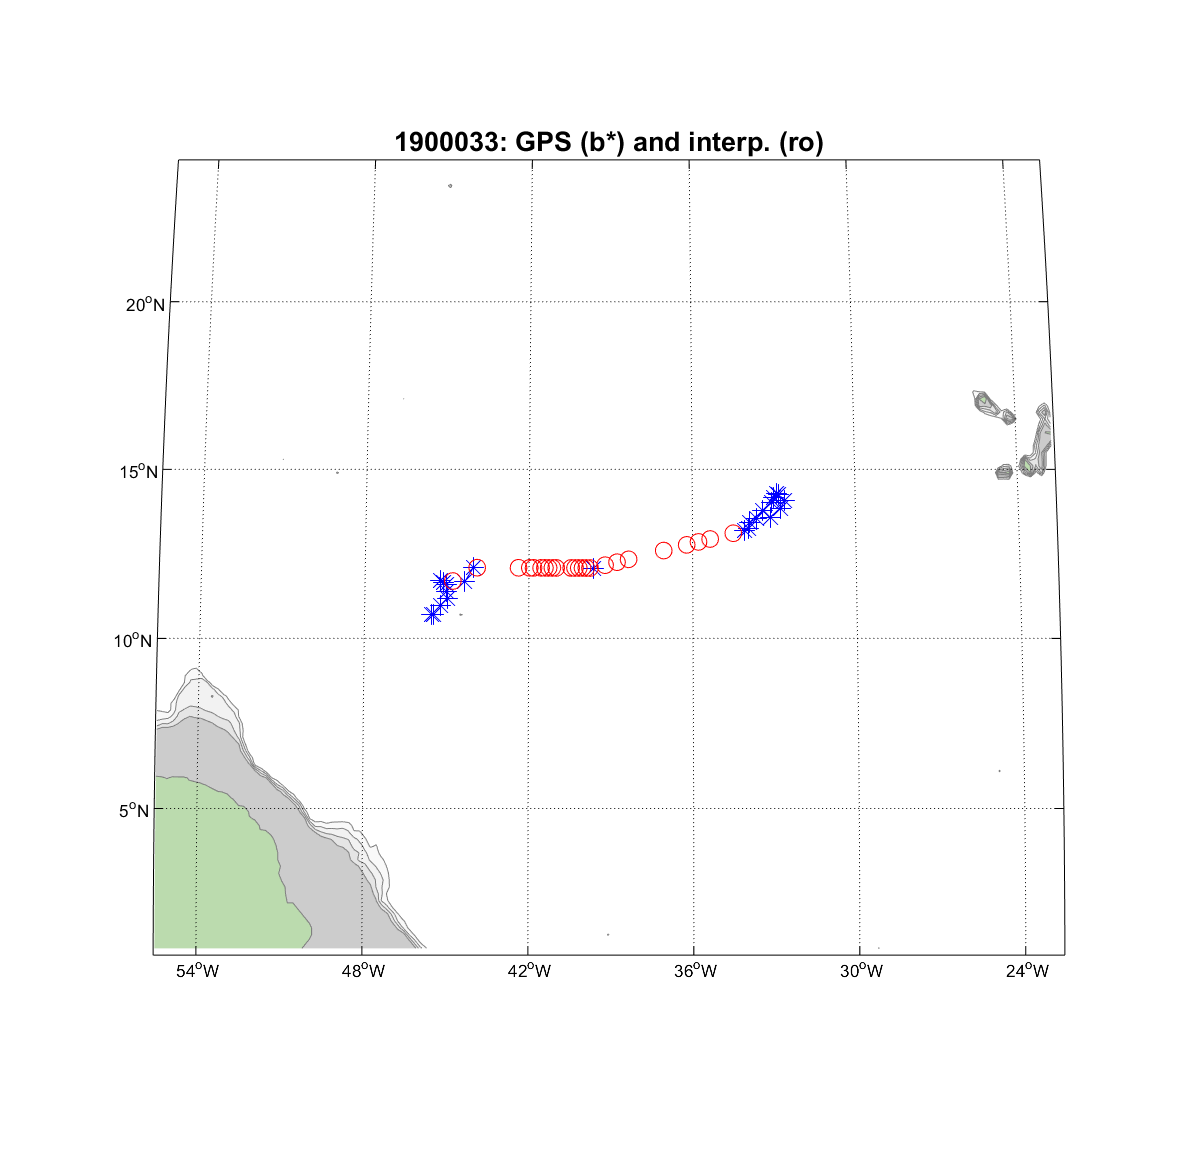
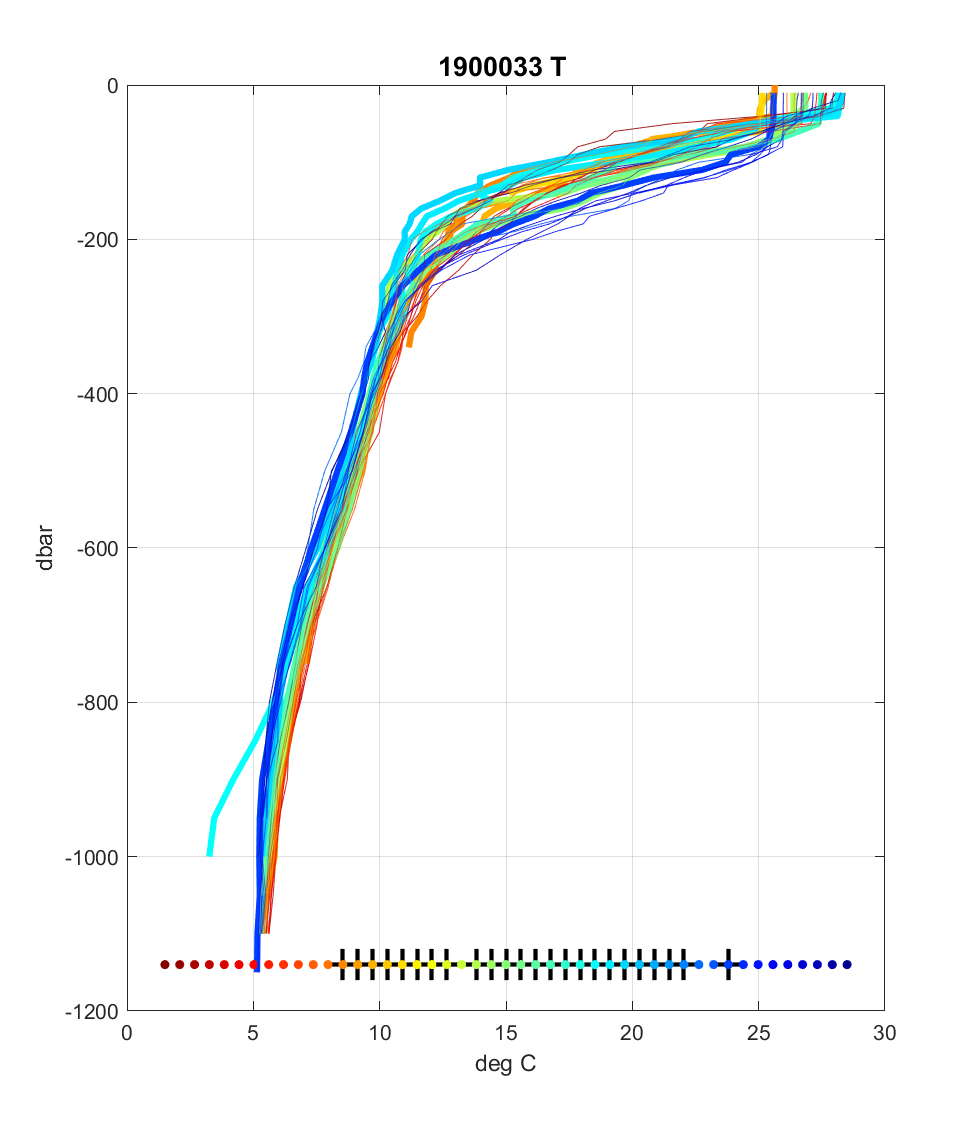
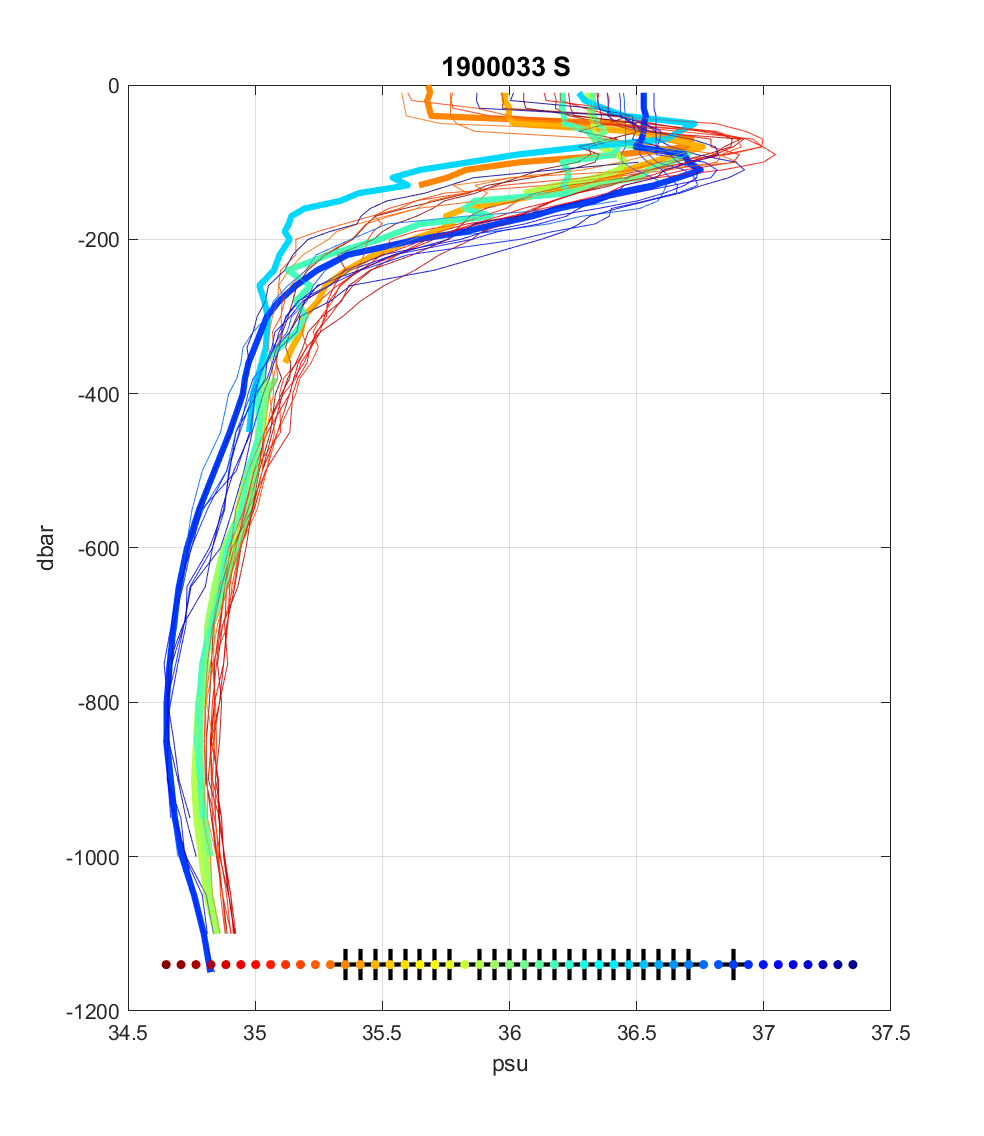
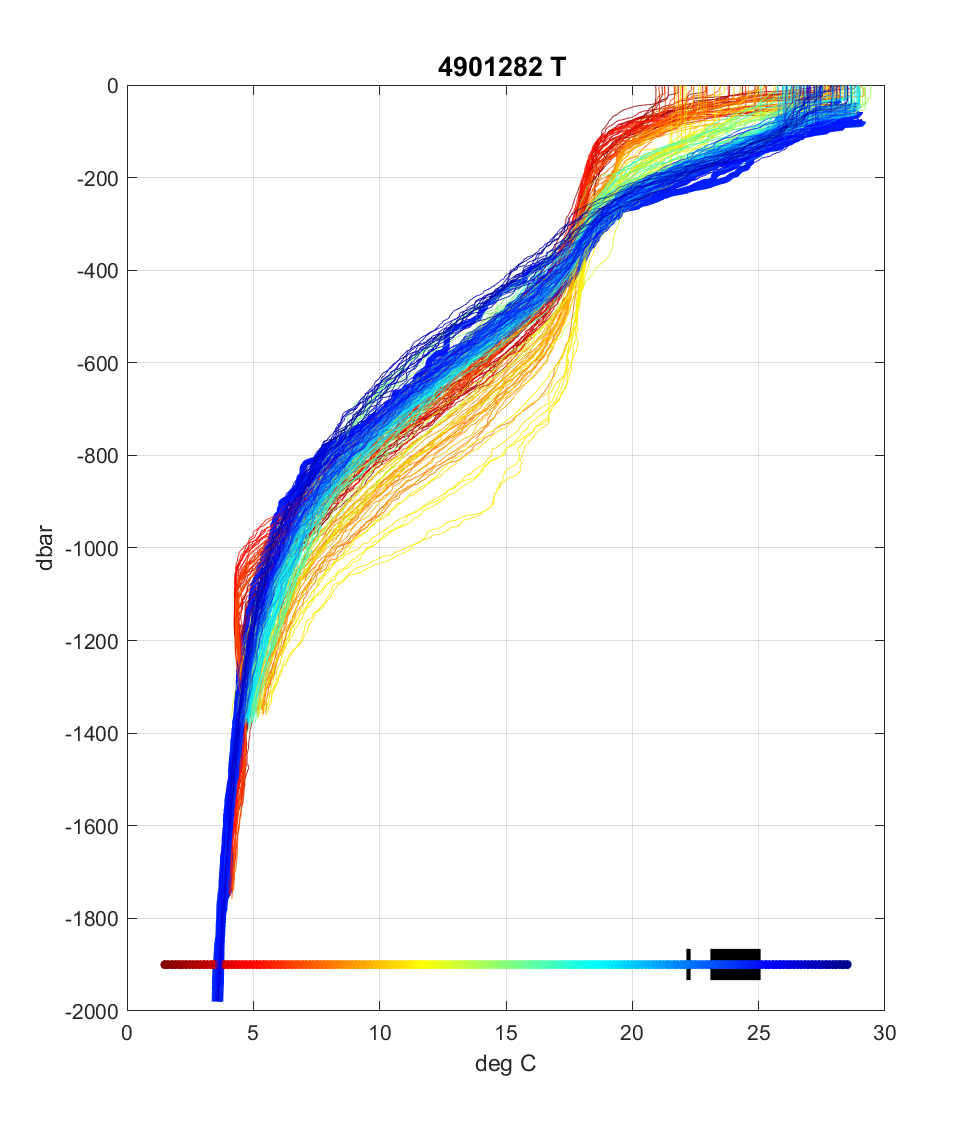
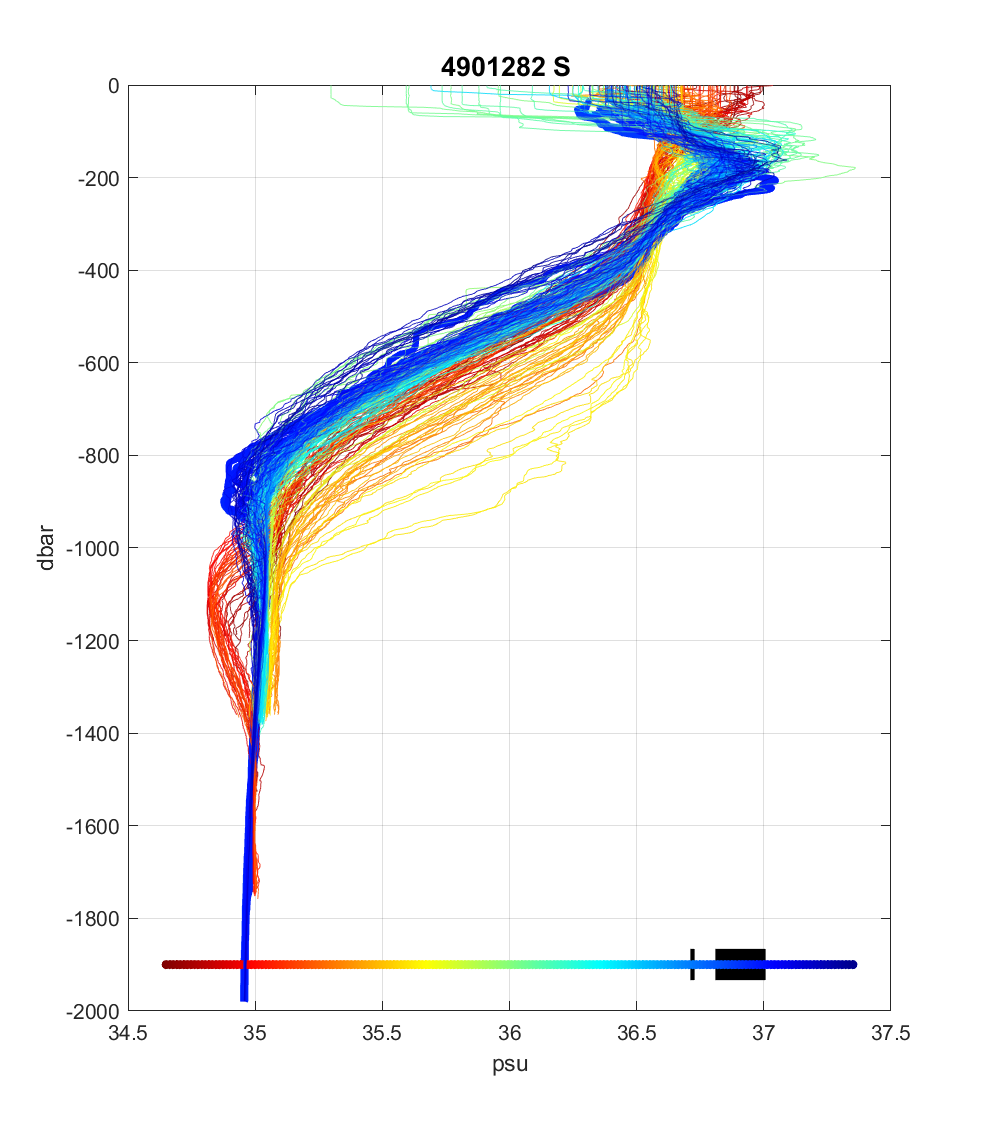
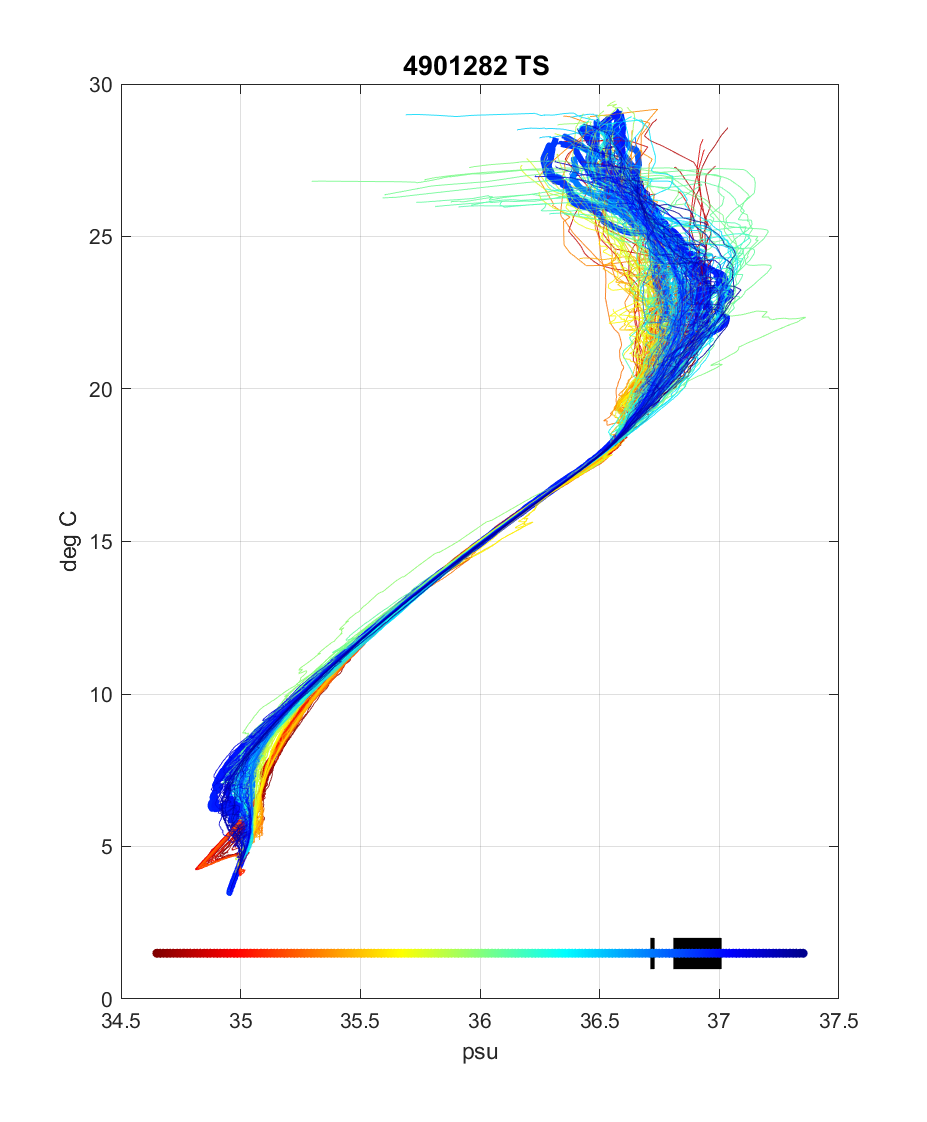
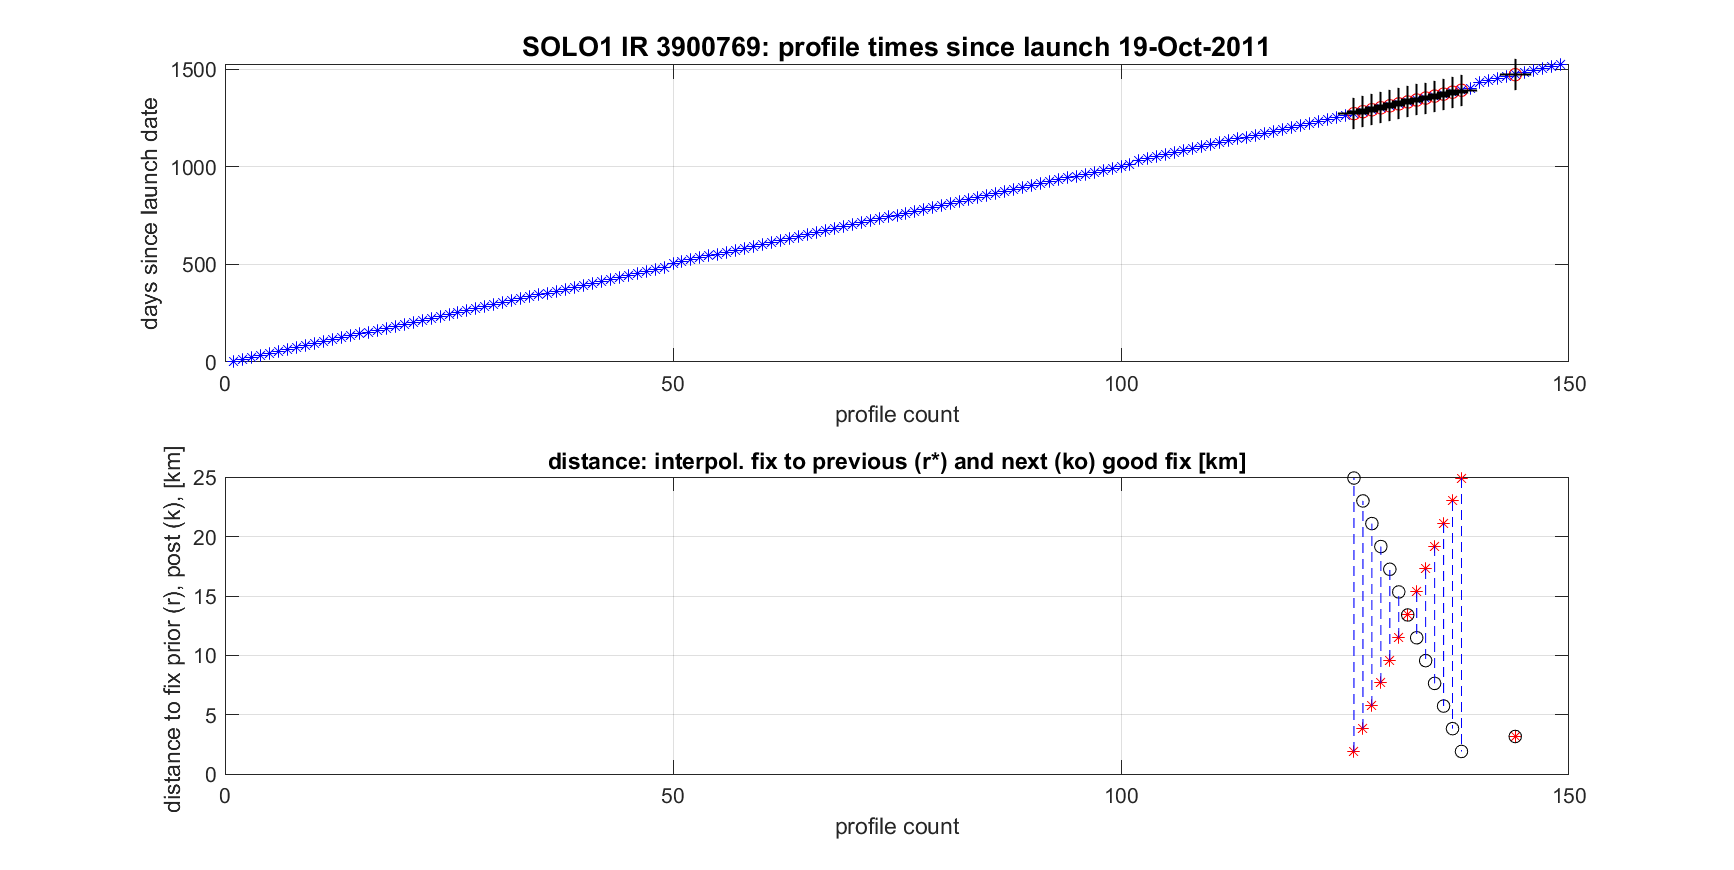
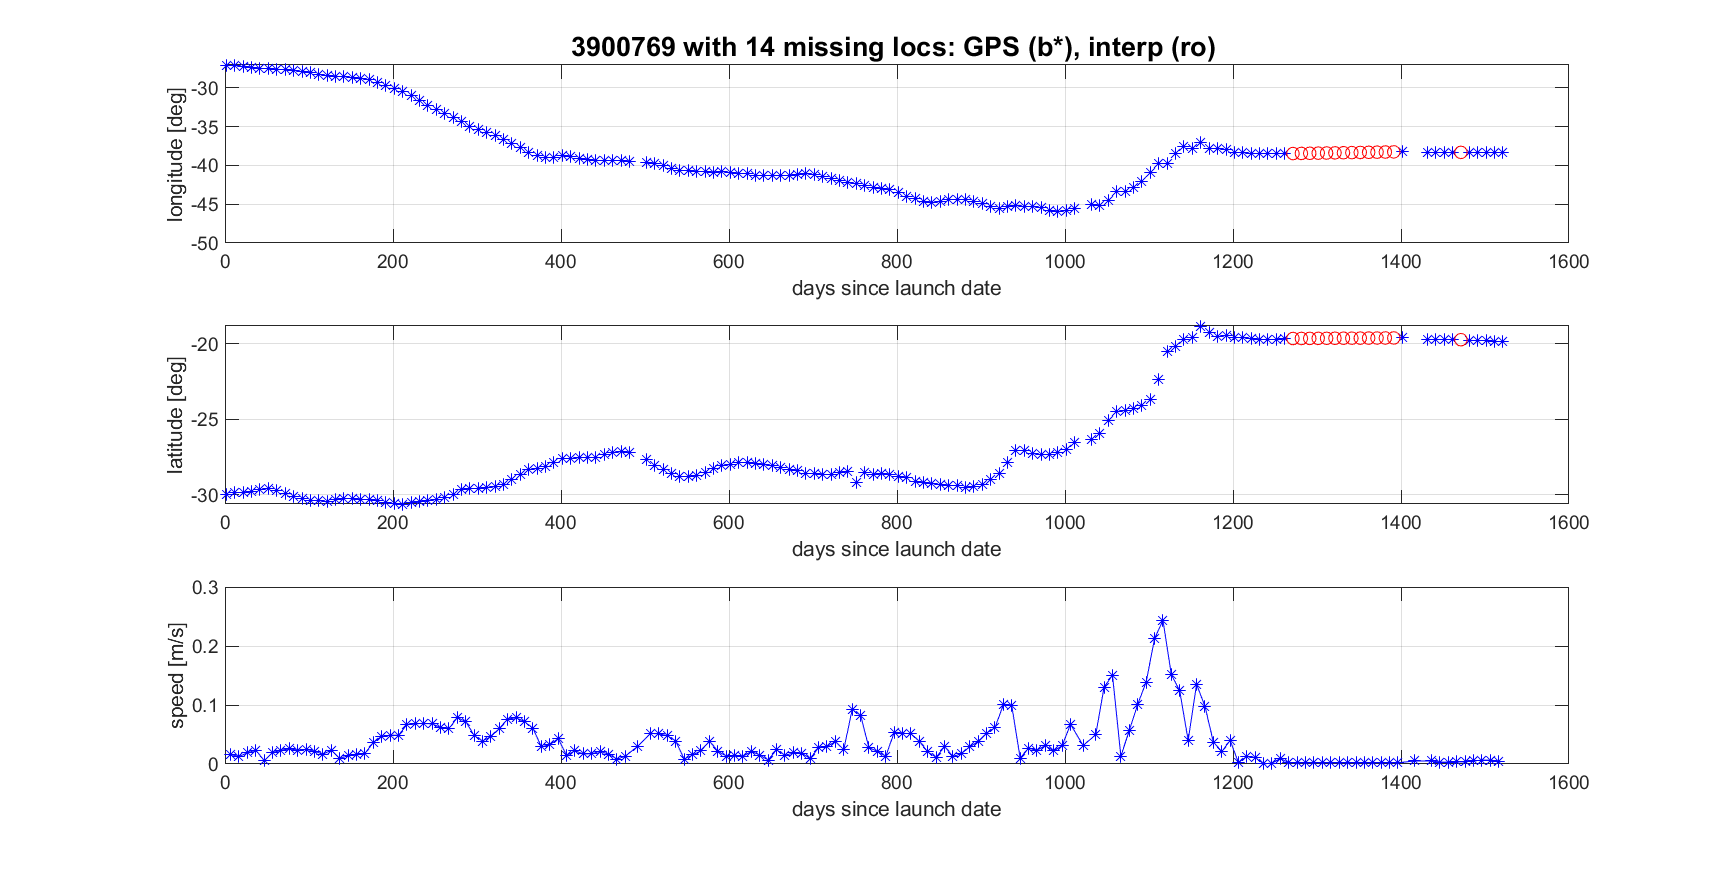
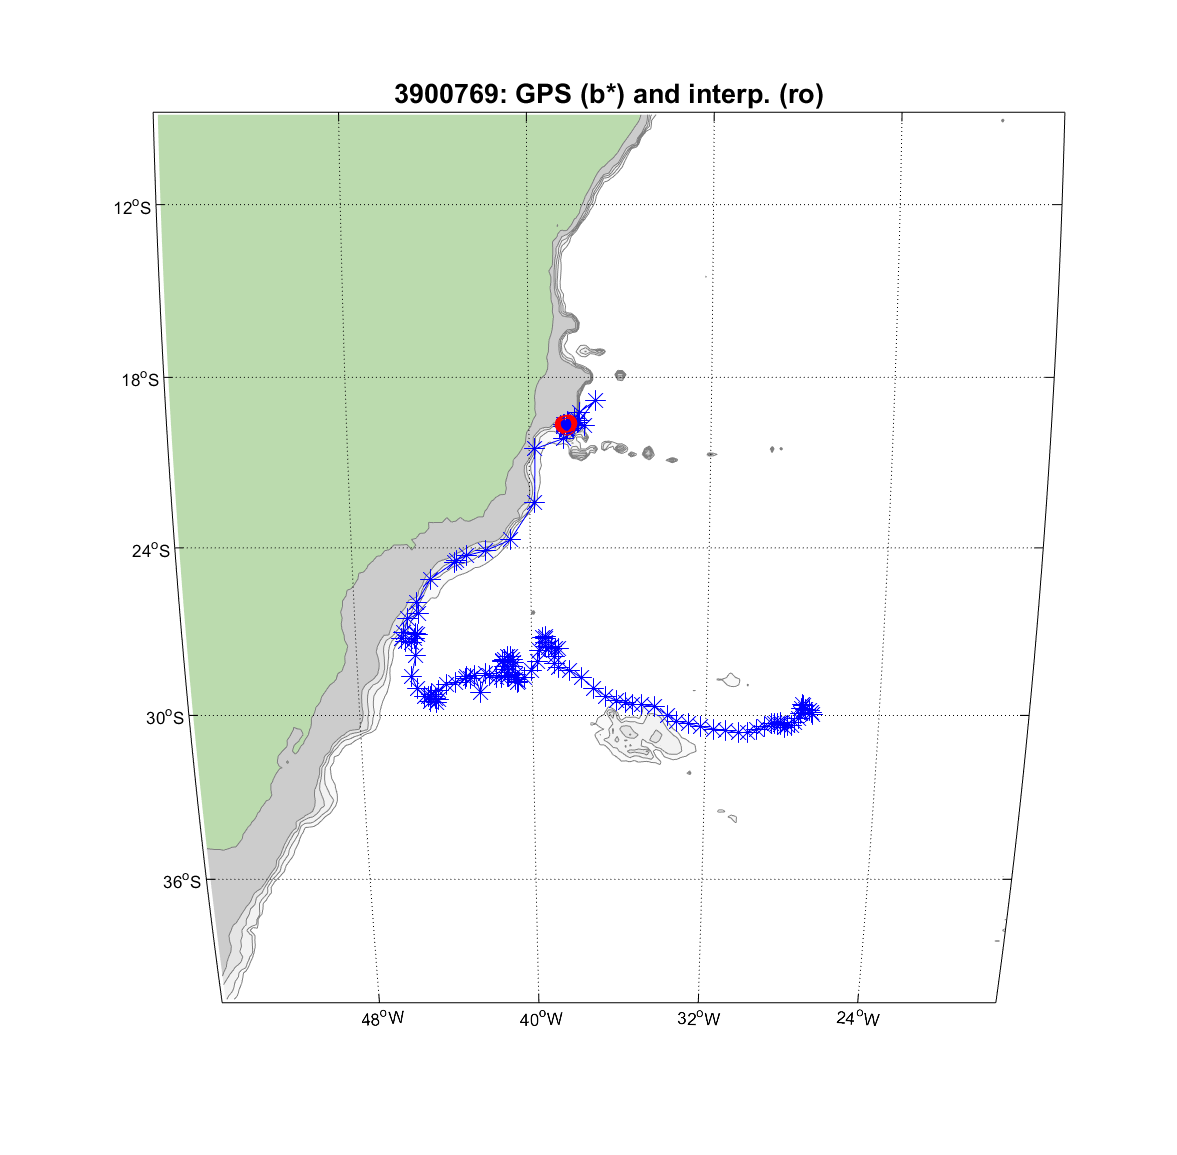
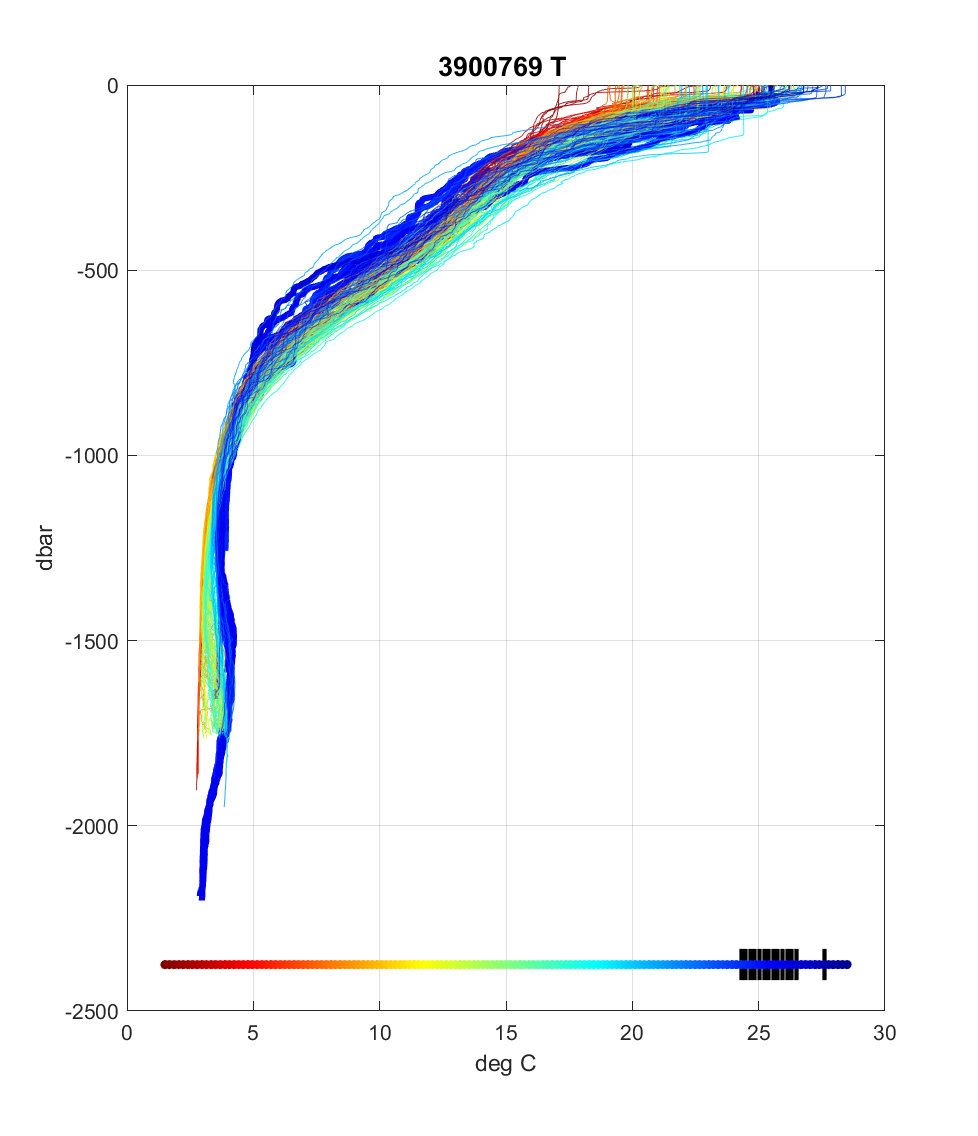
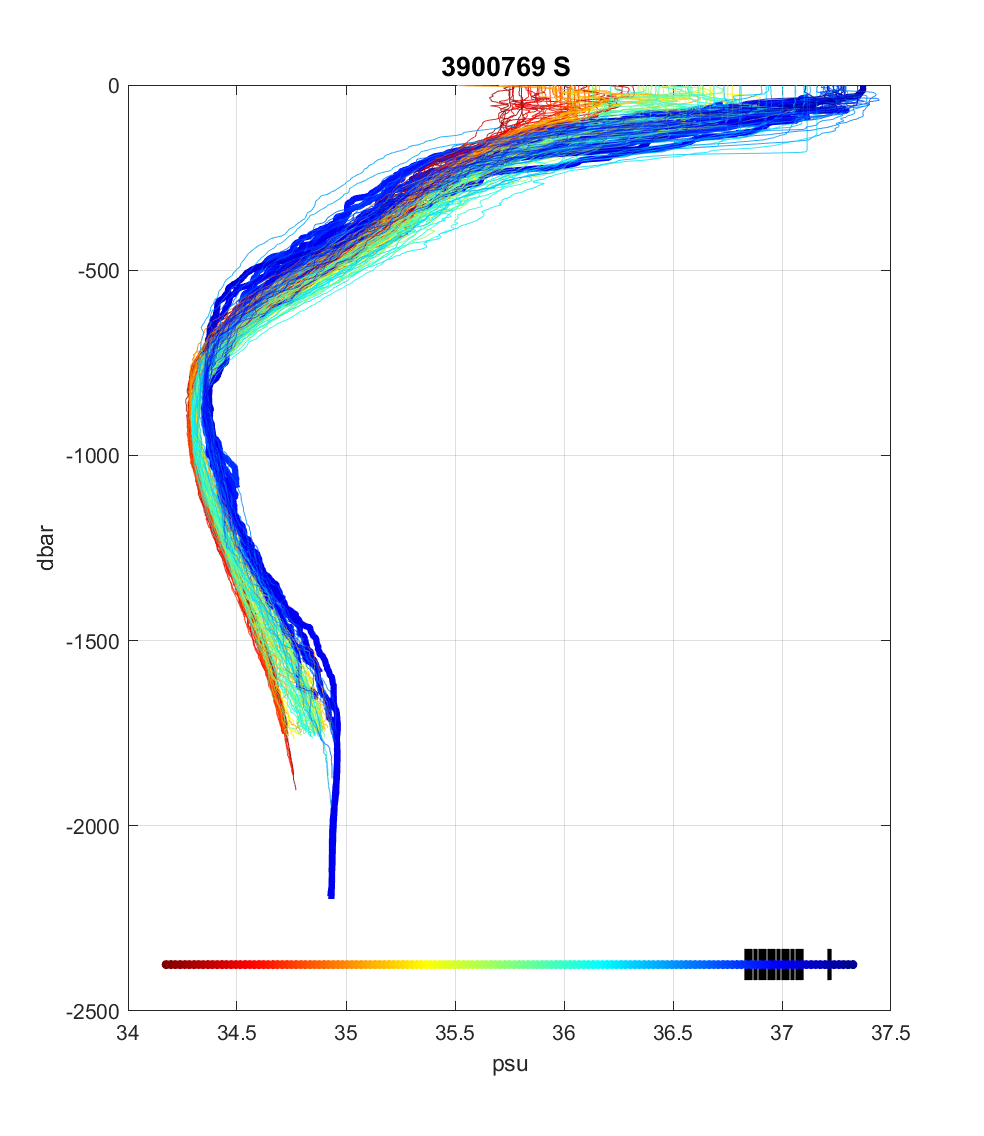
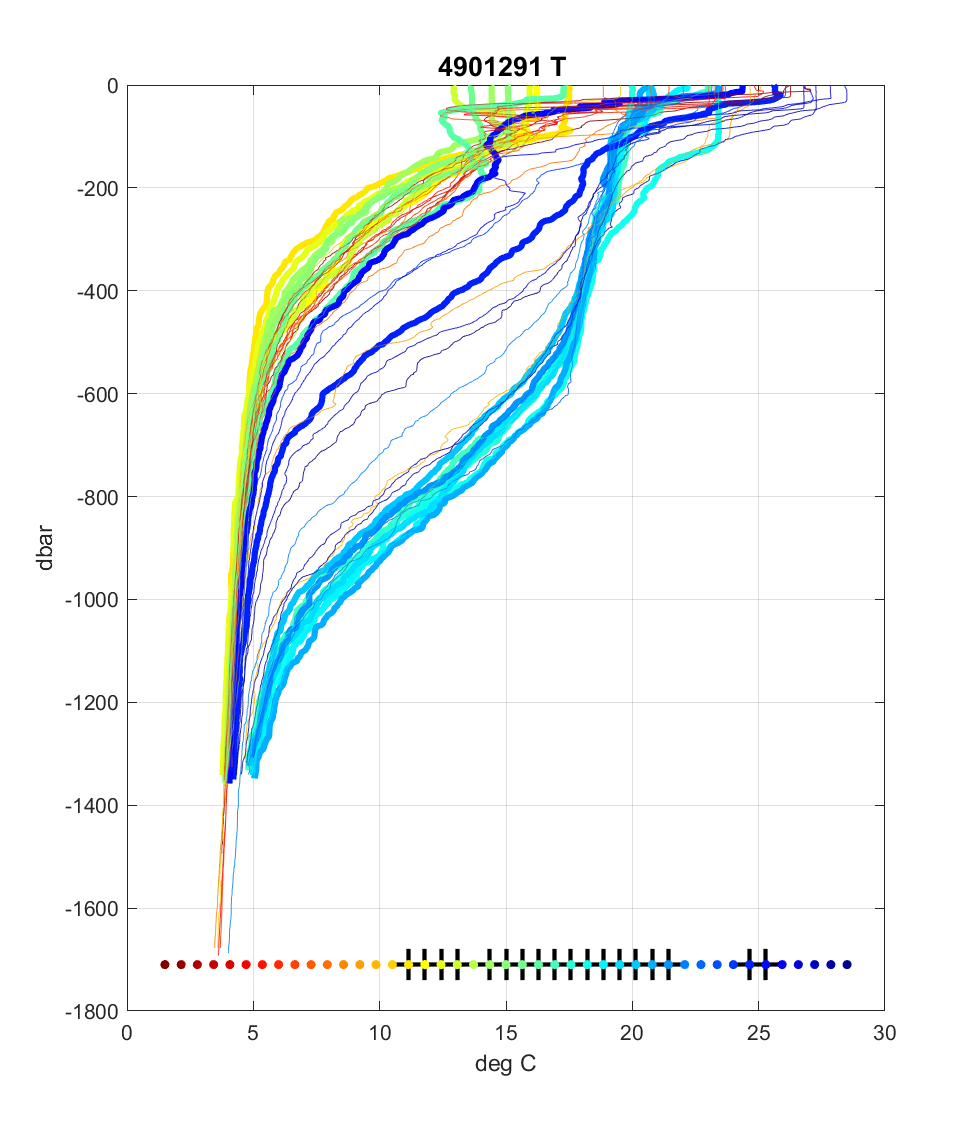
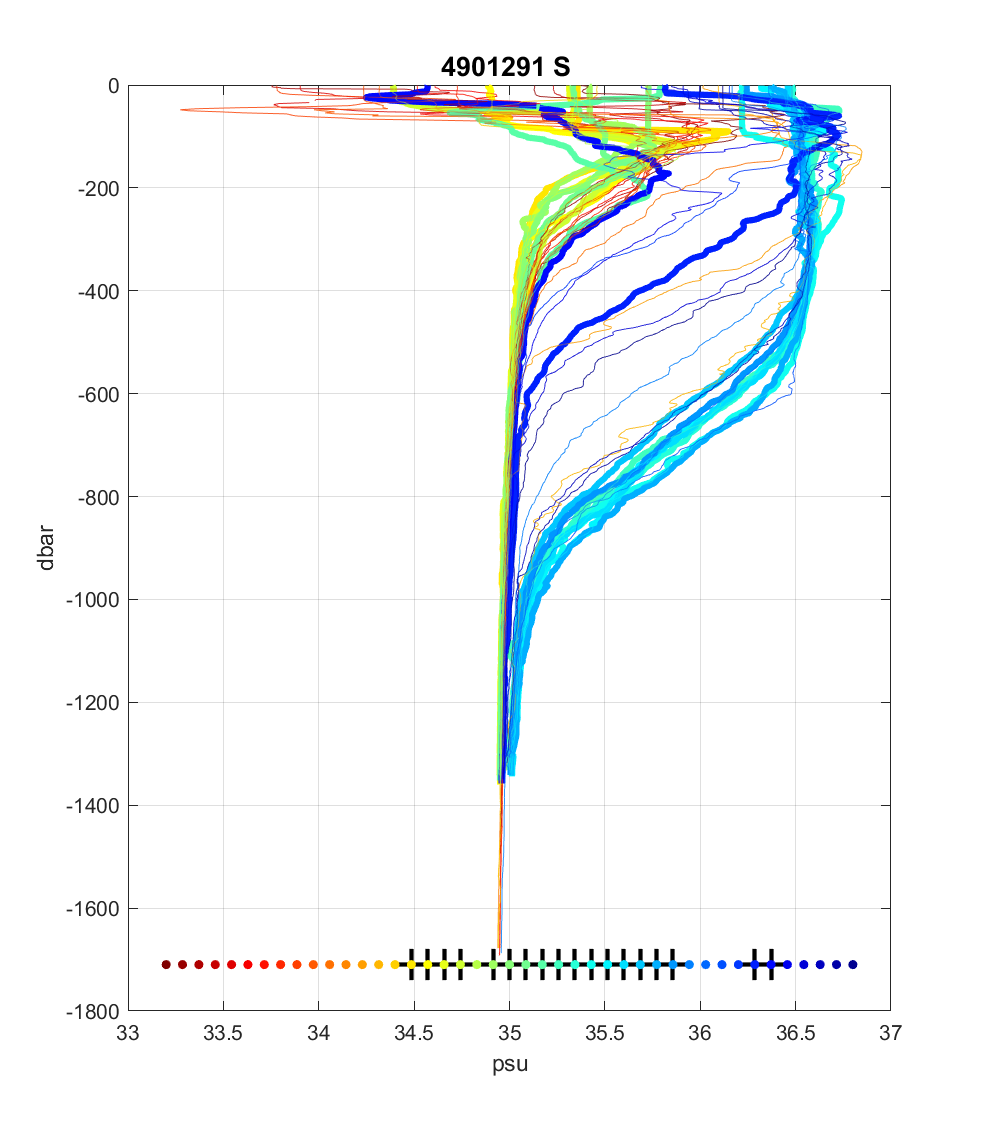
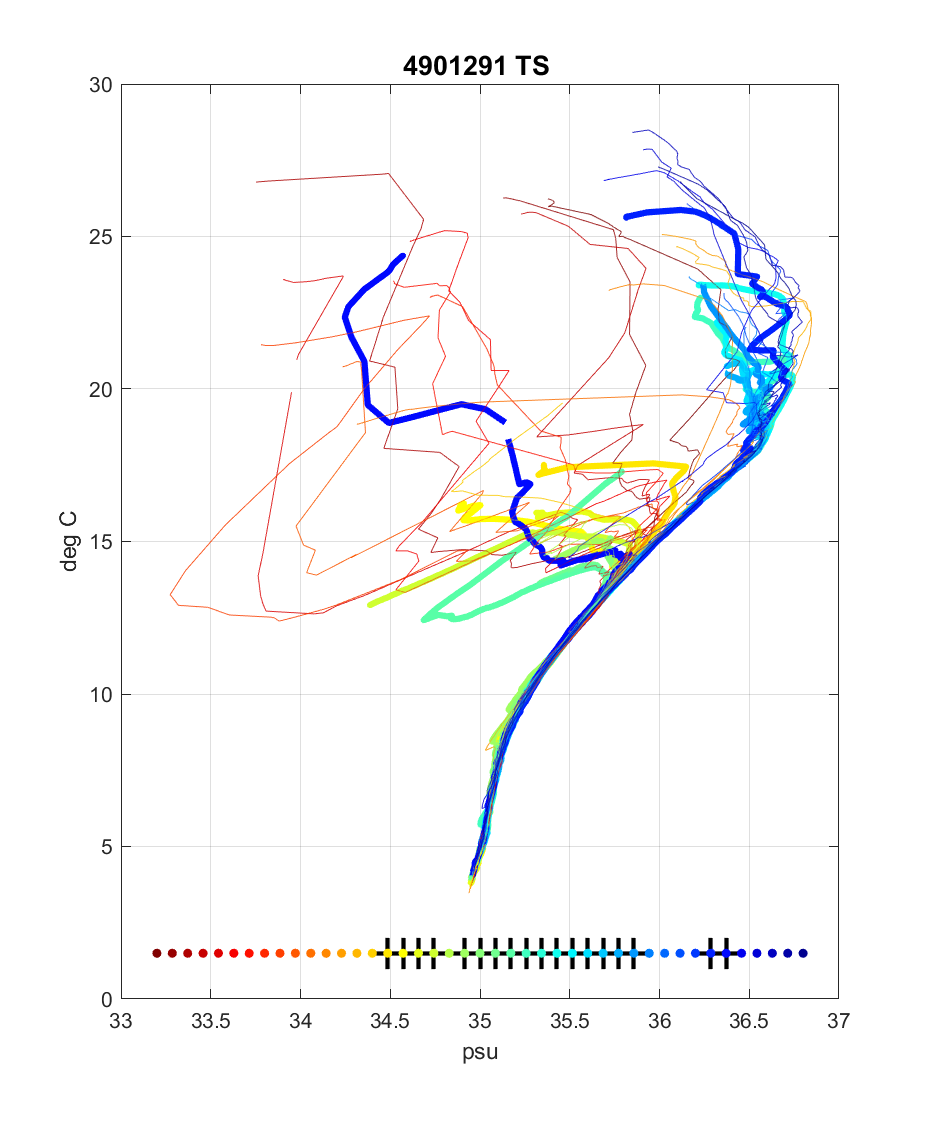
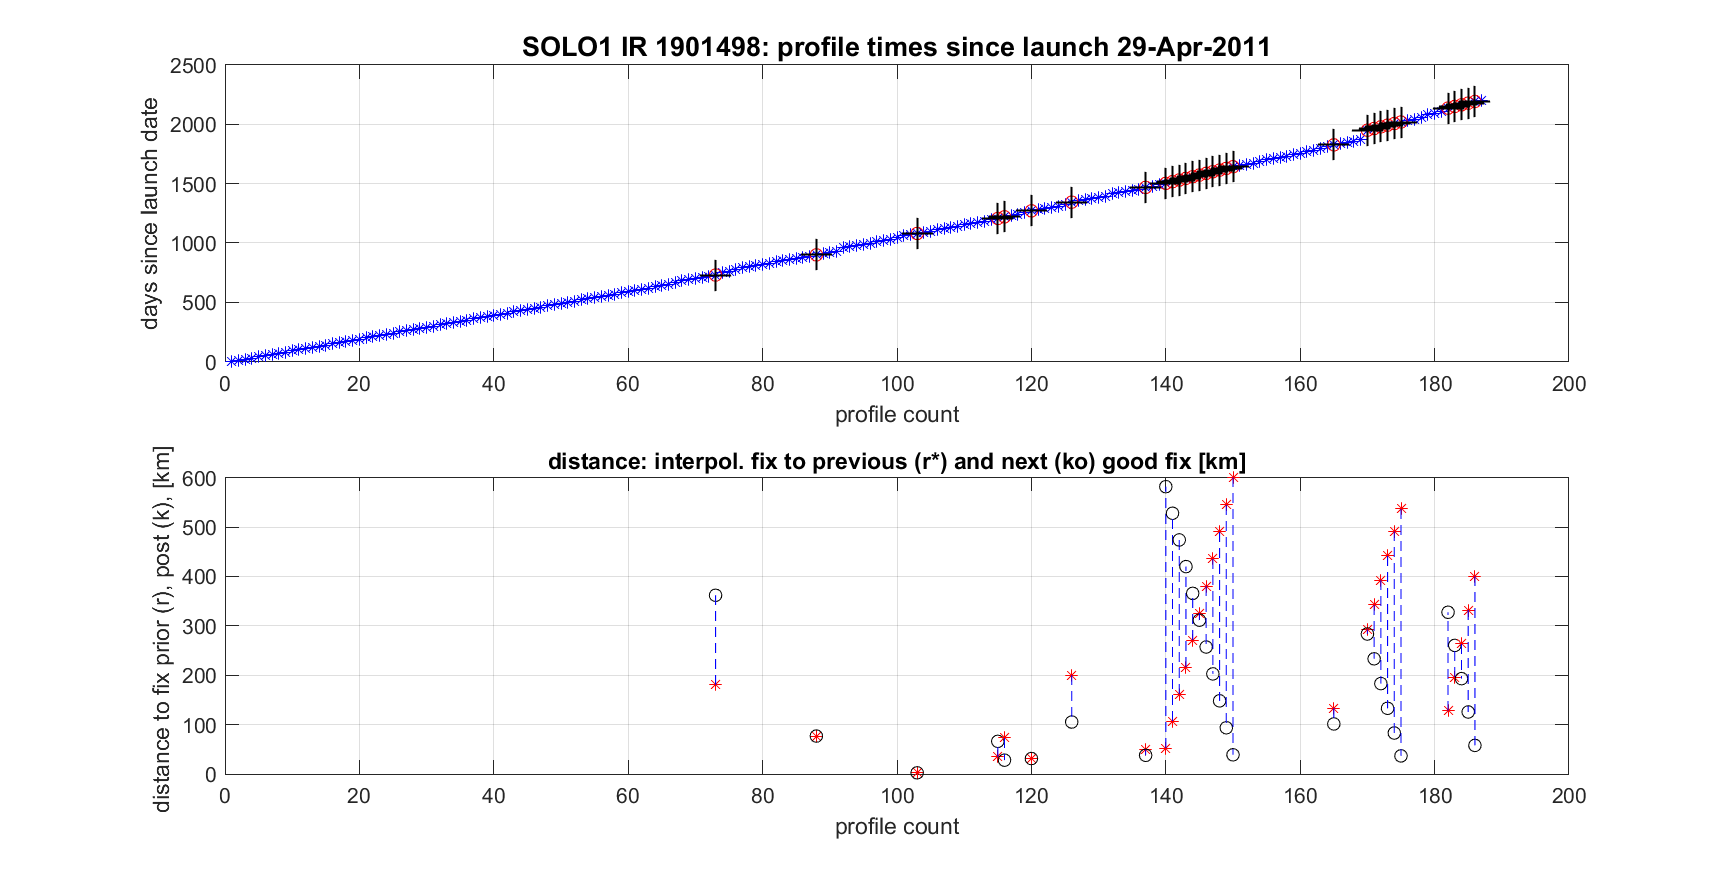
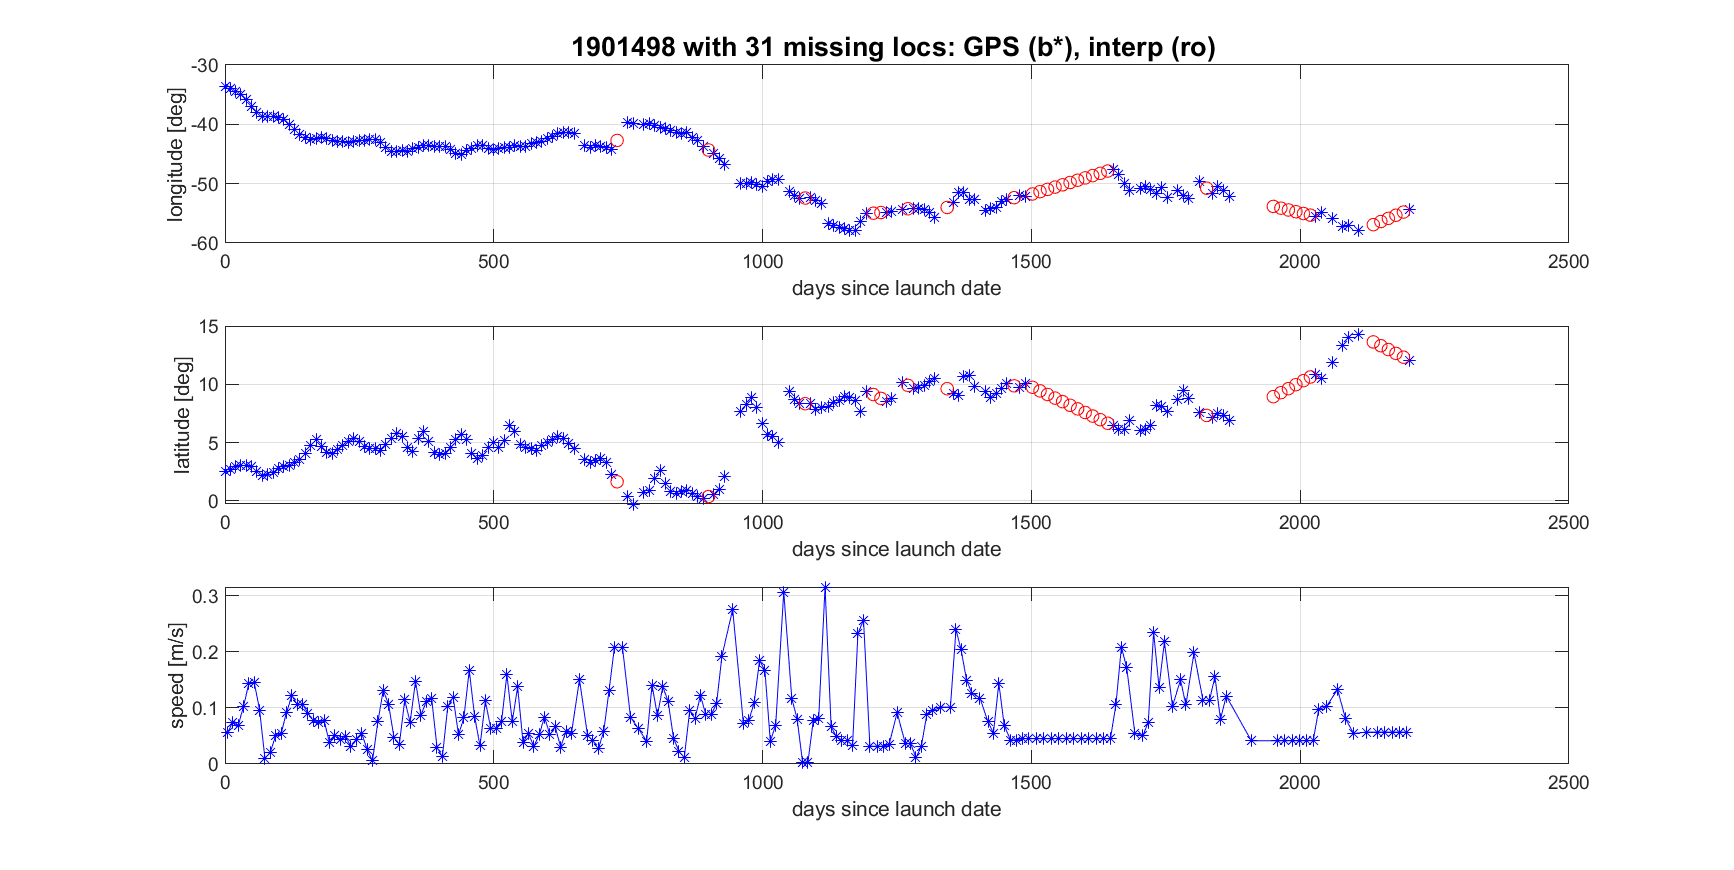
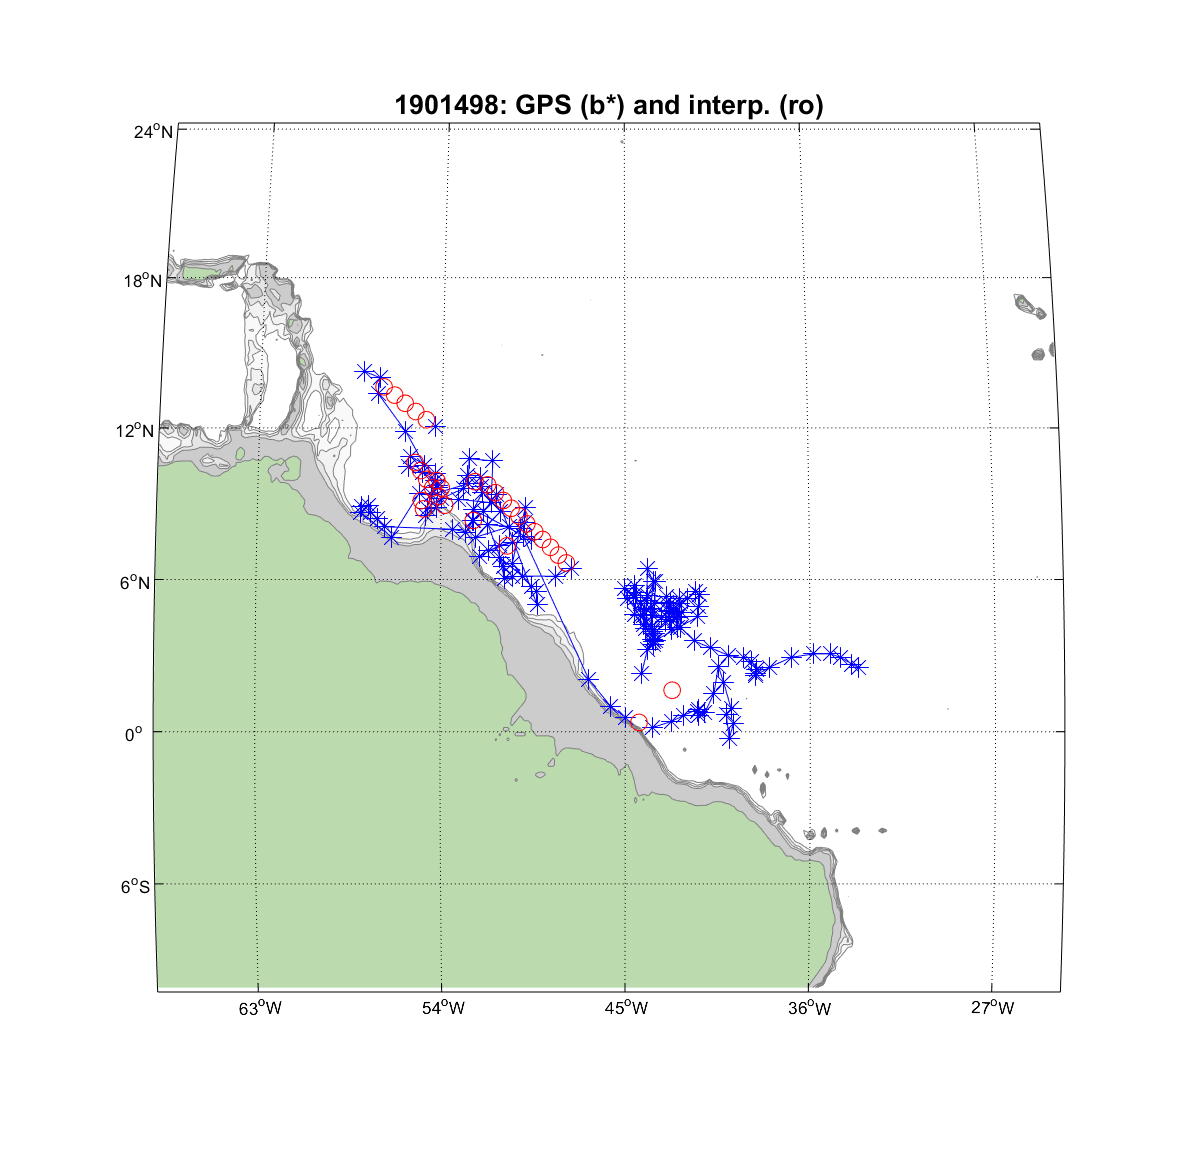
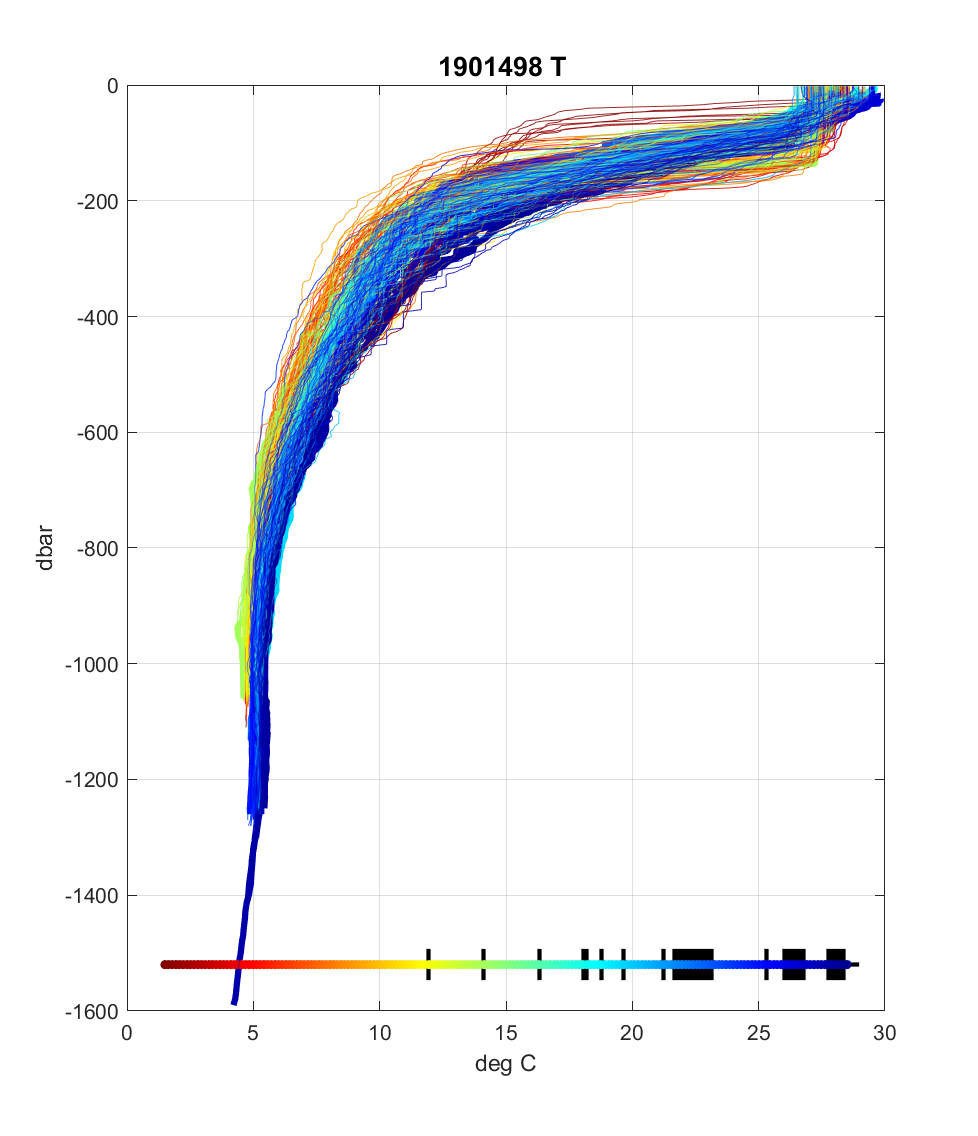
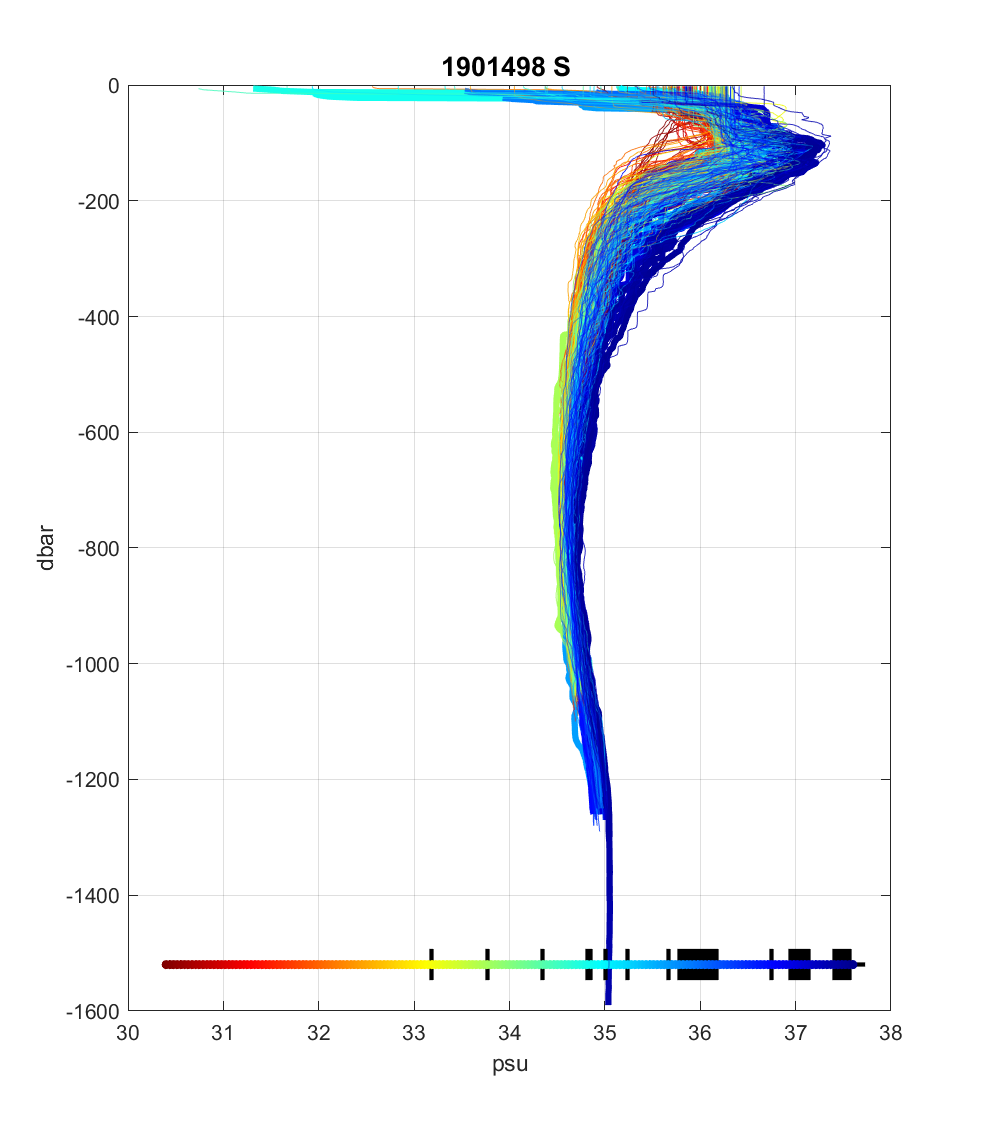
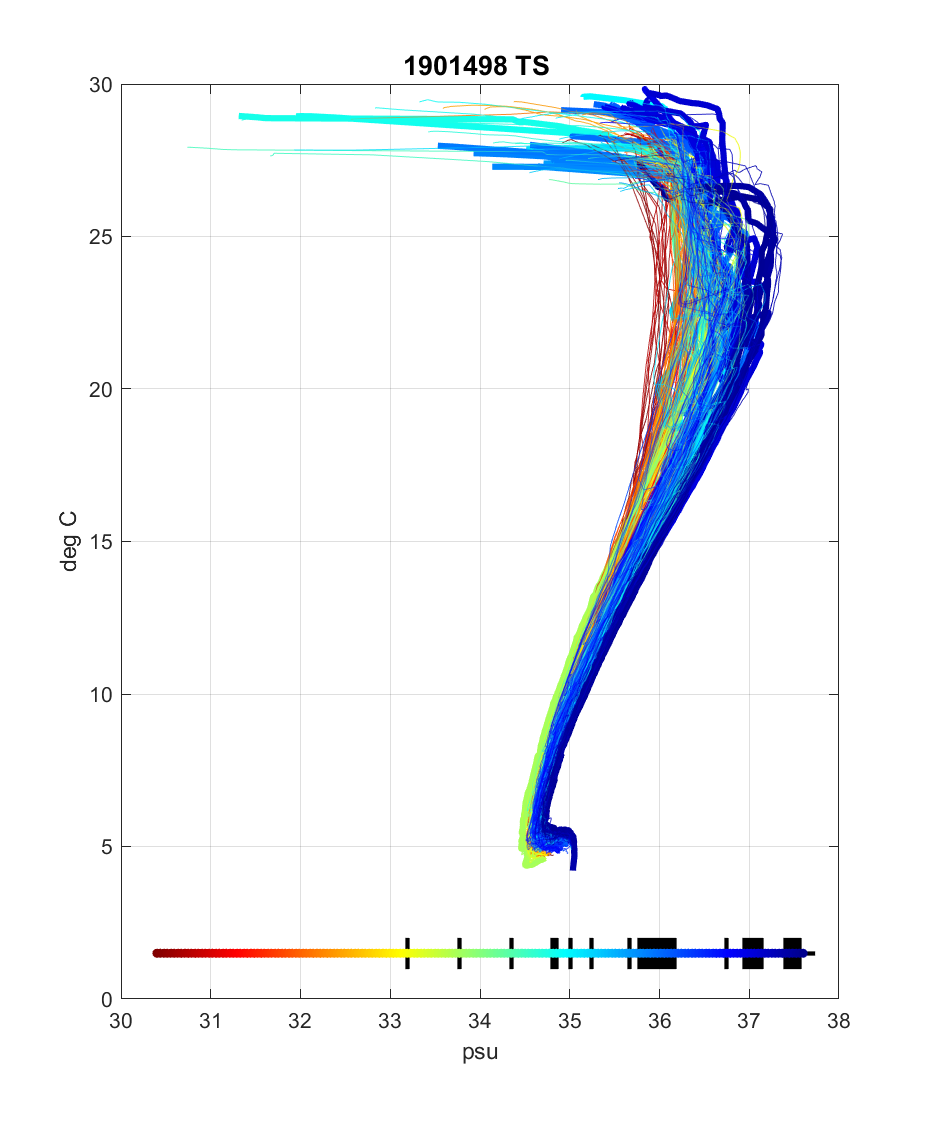
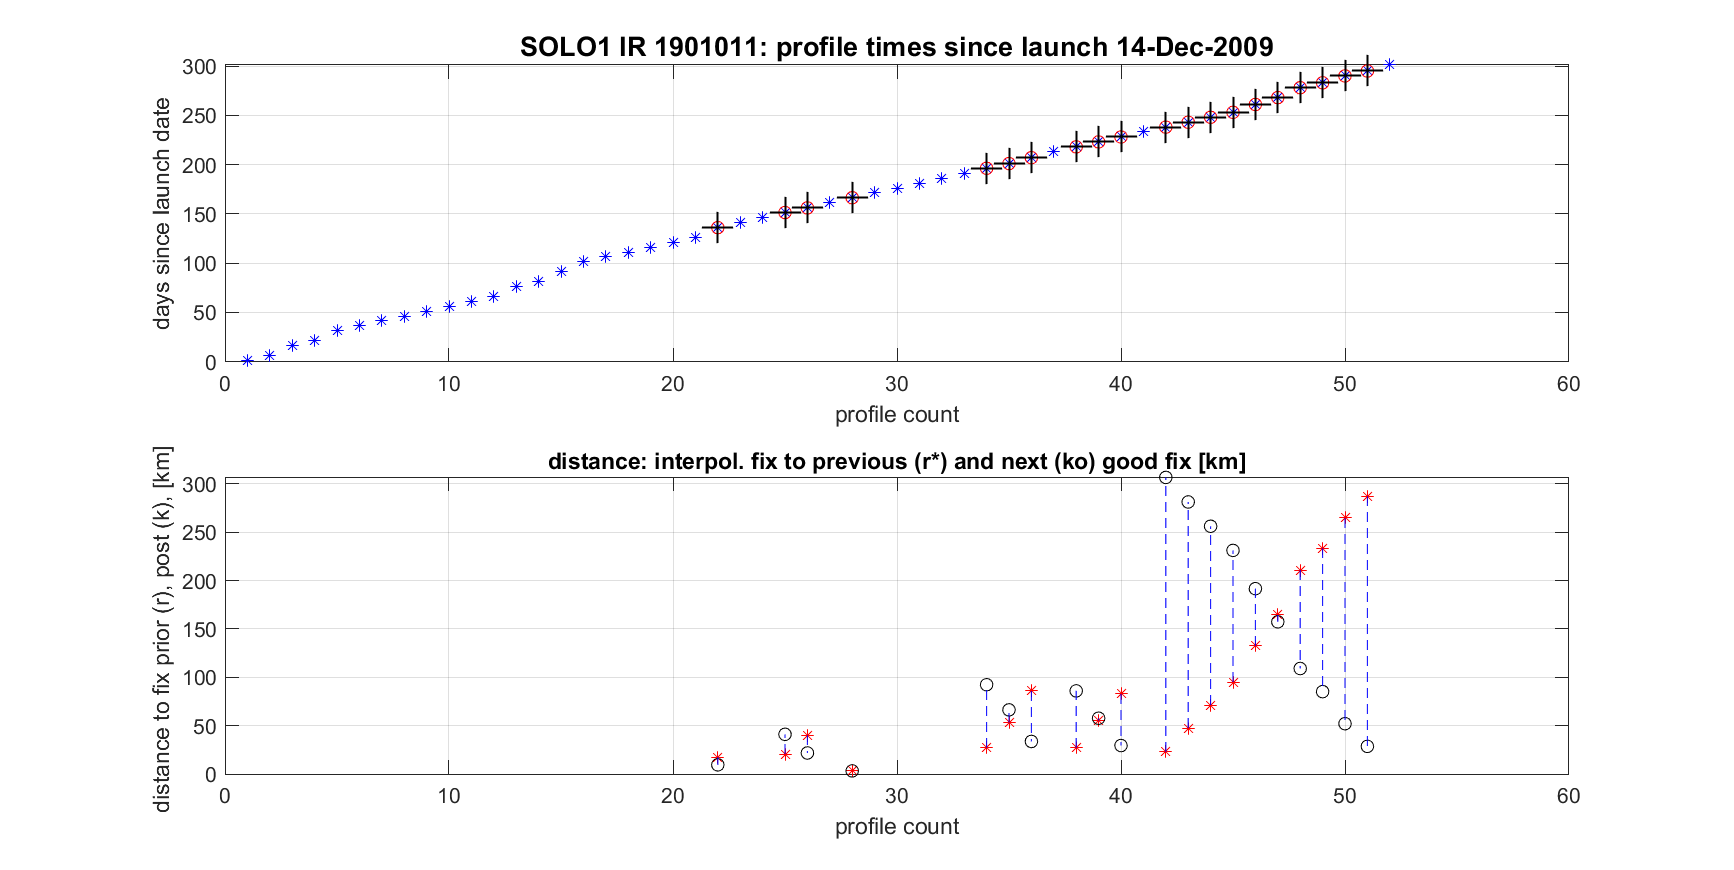
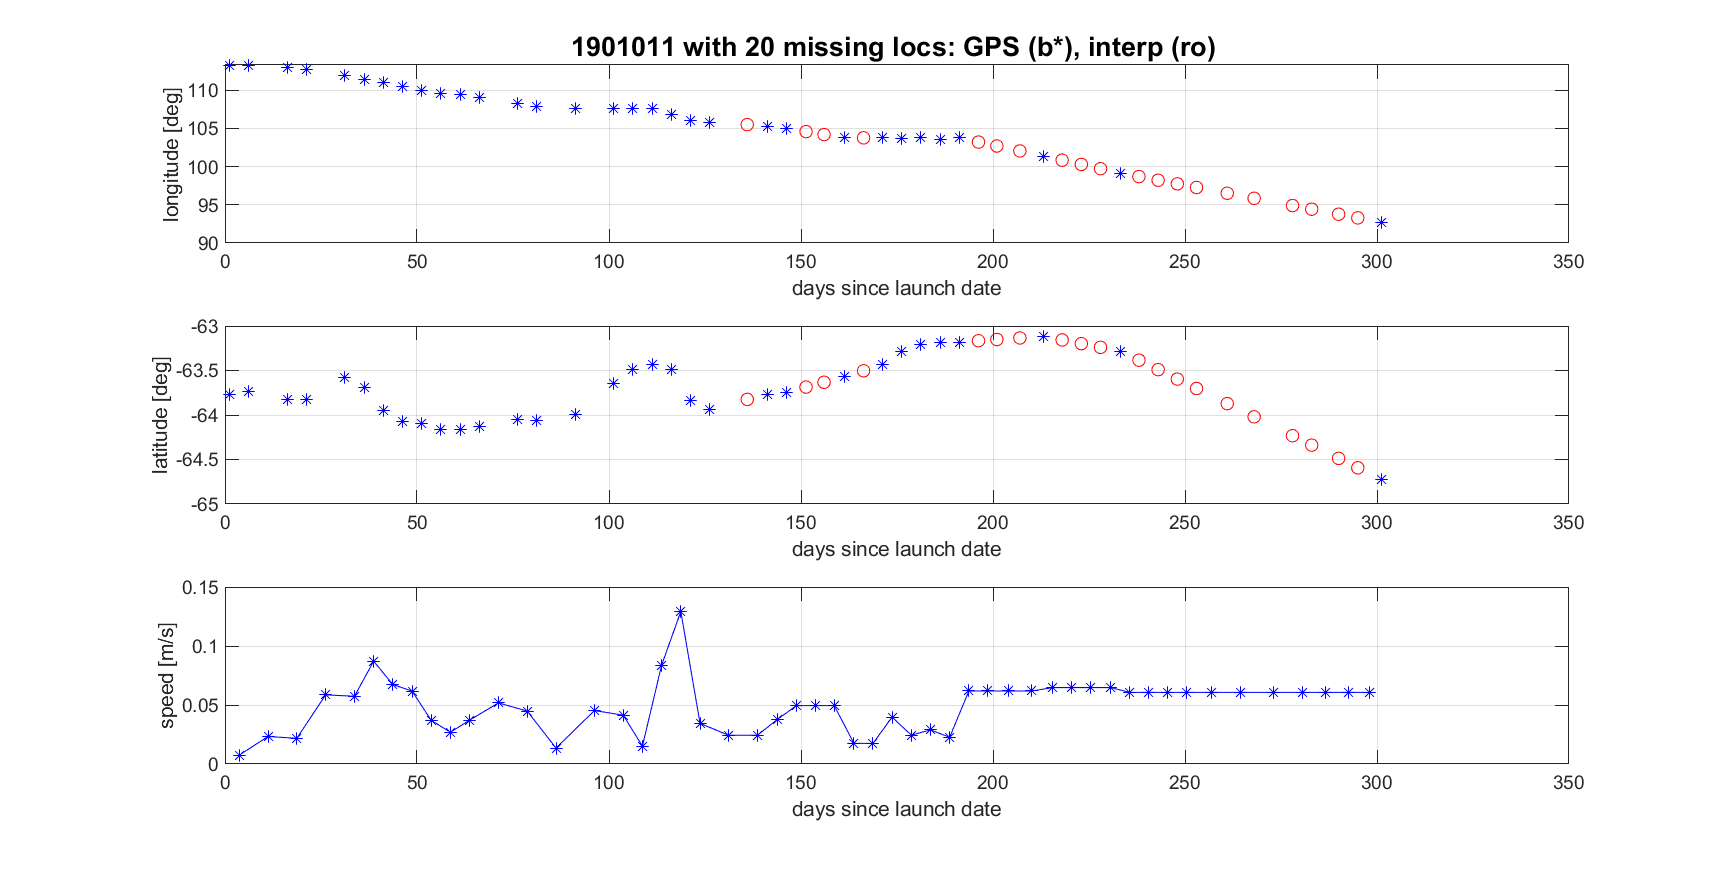
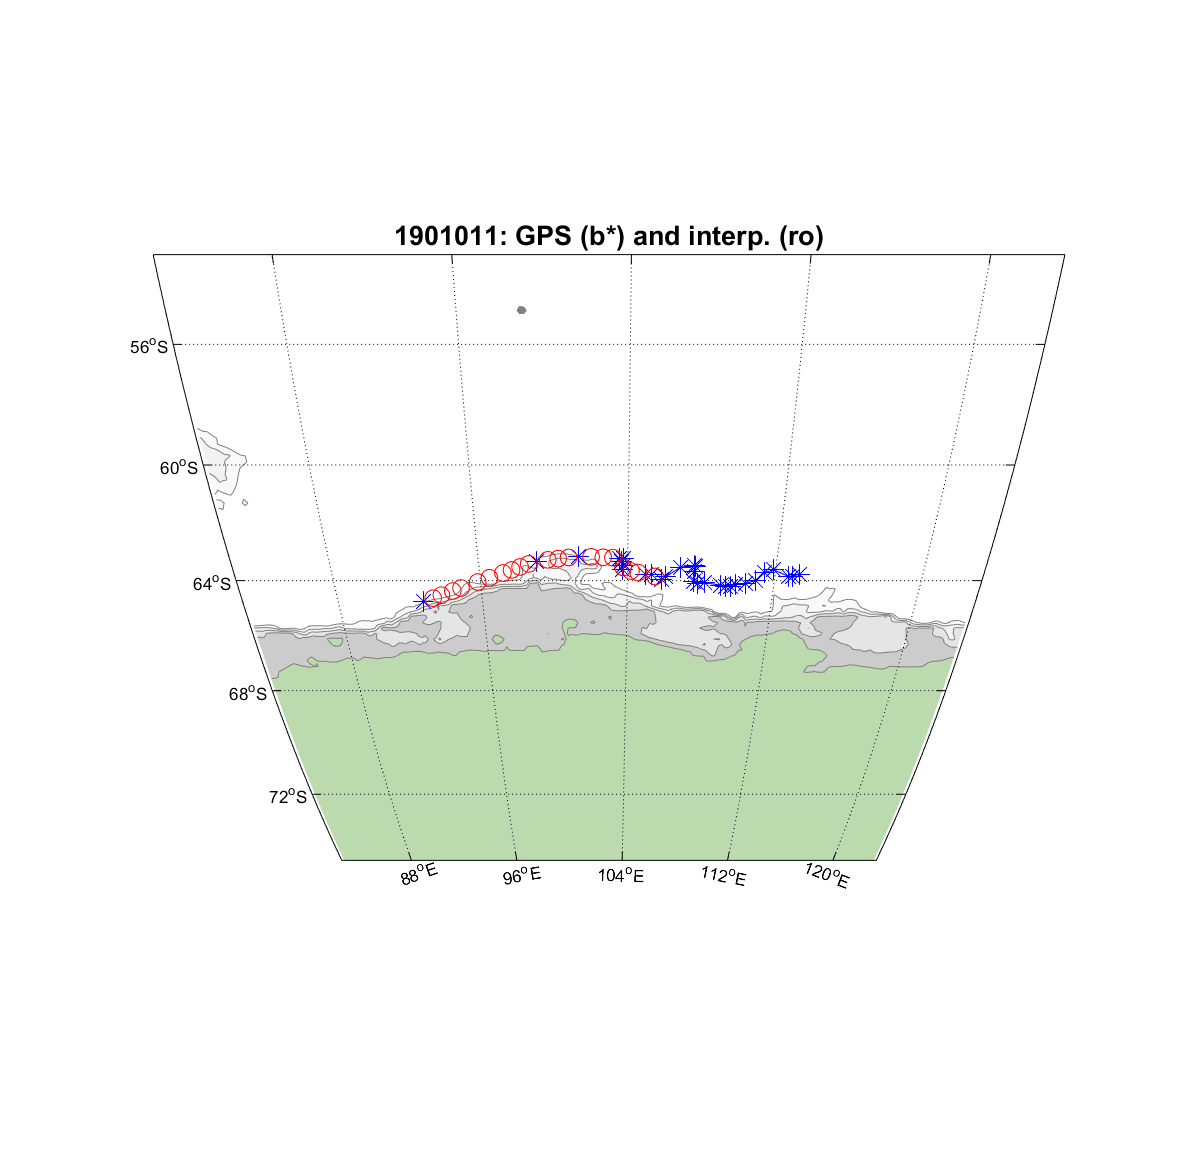
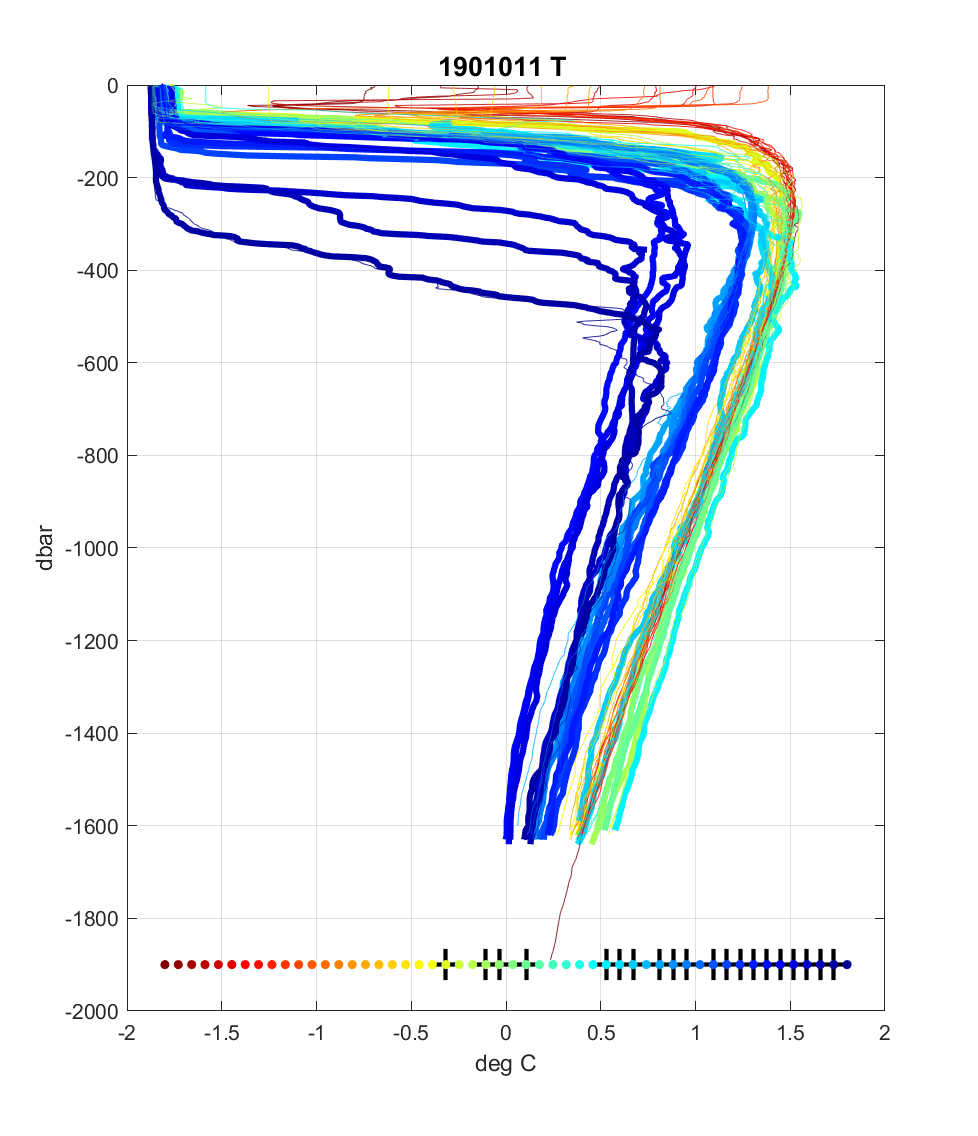
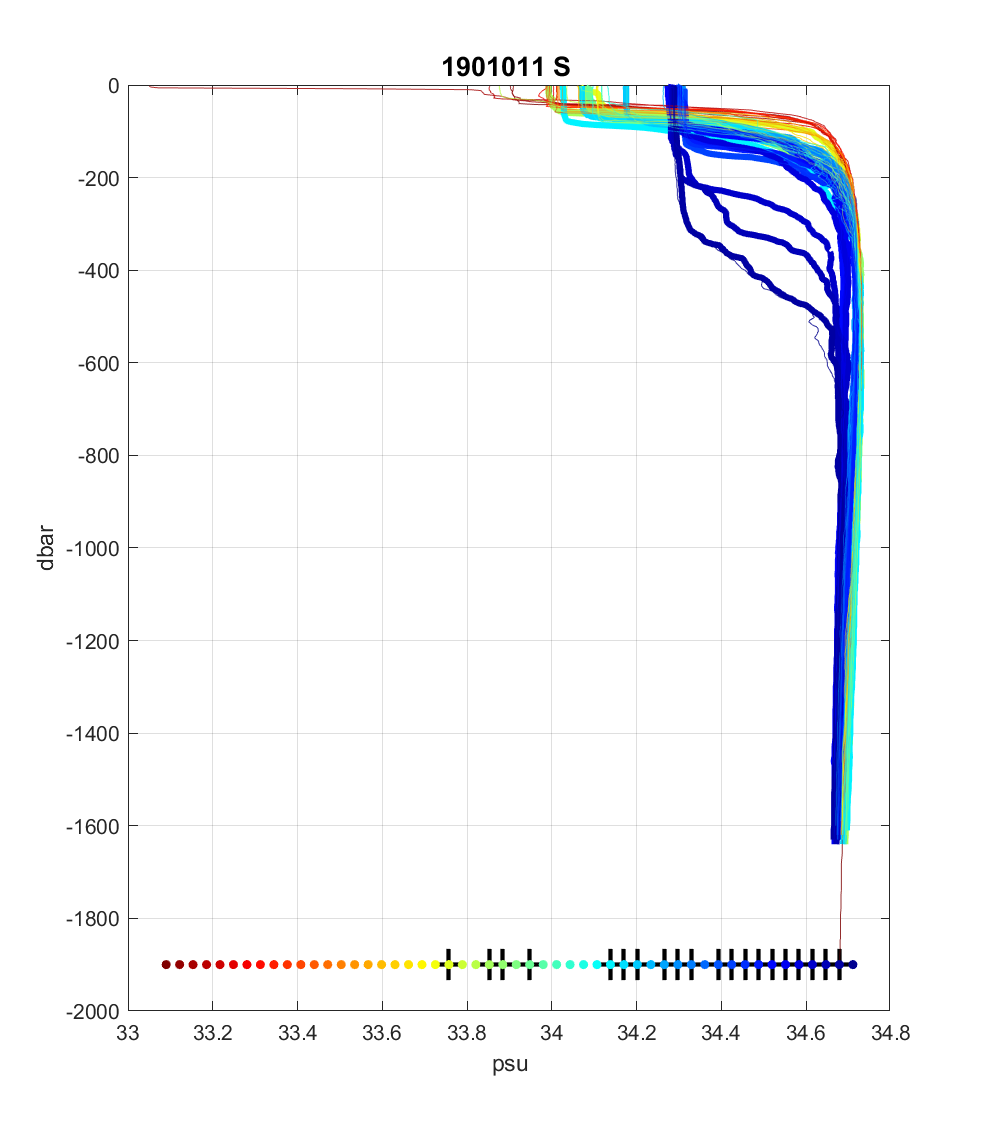
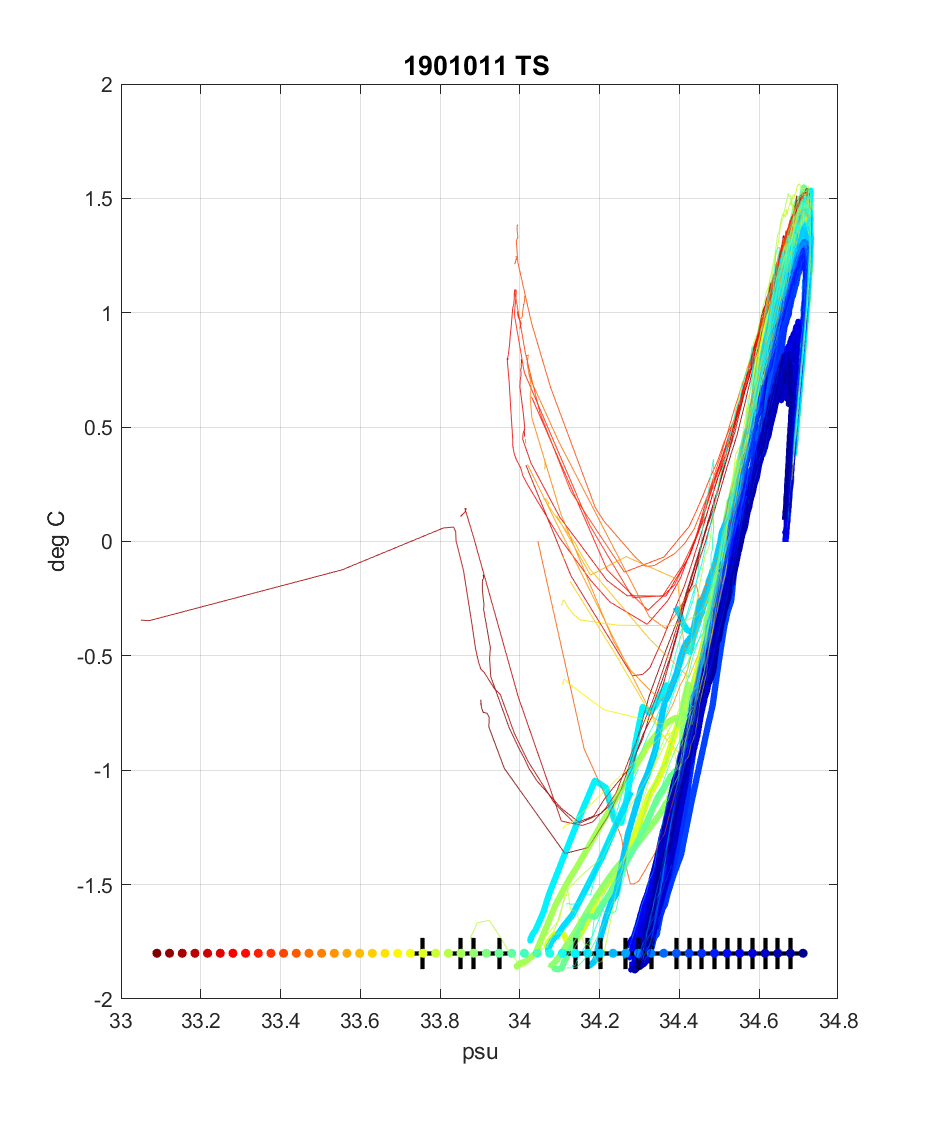
The figures below show: |
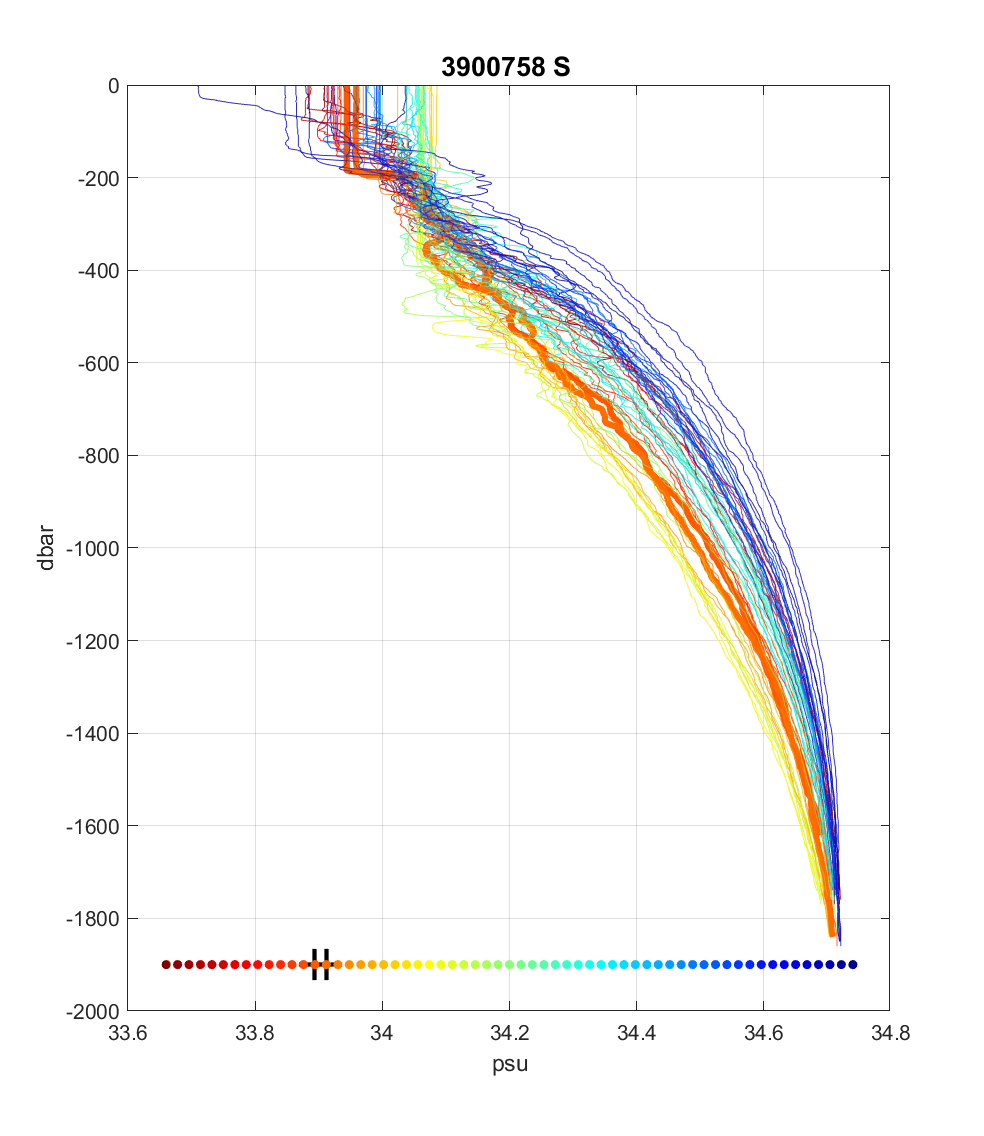
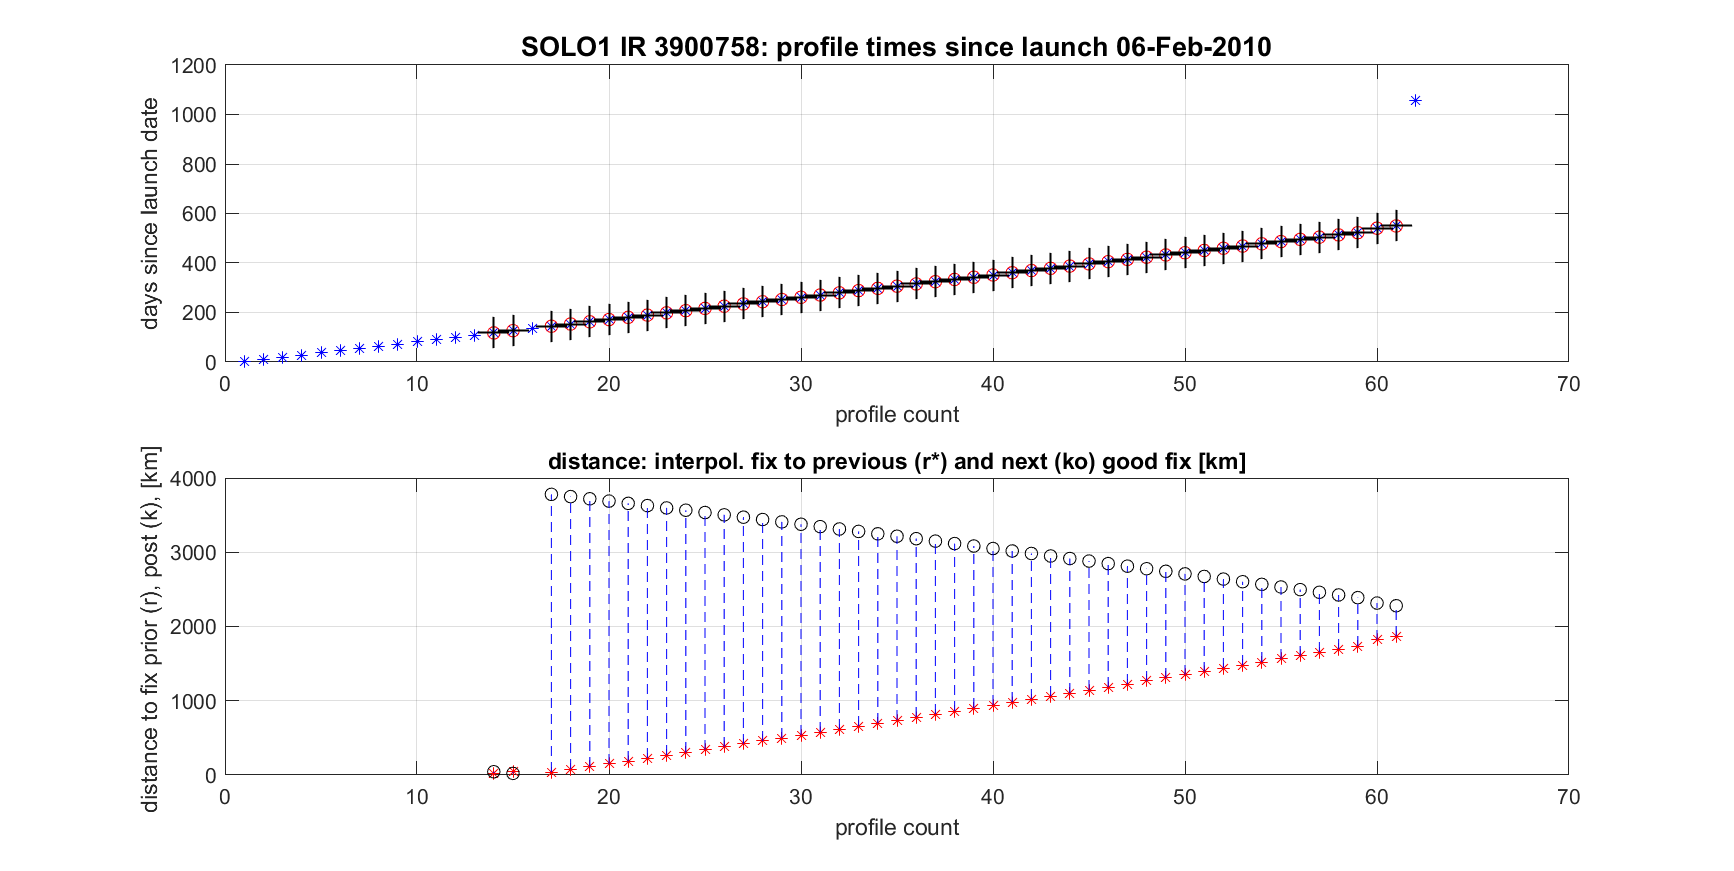
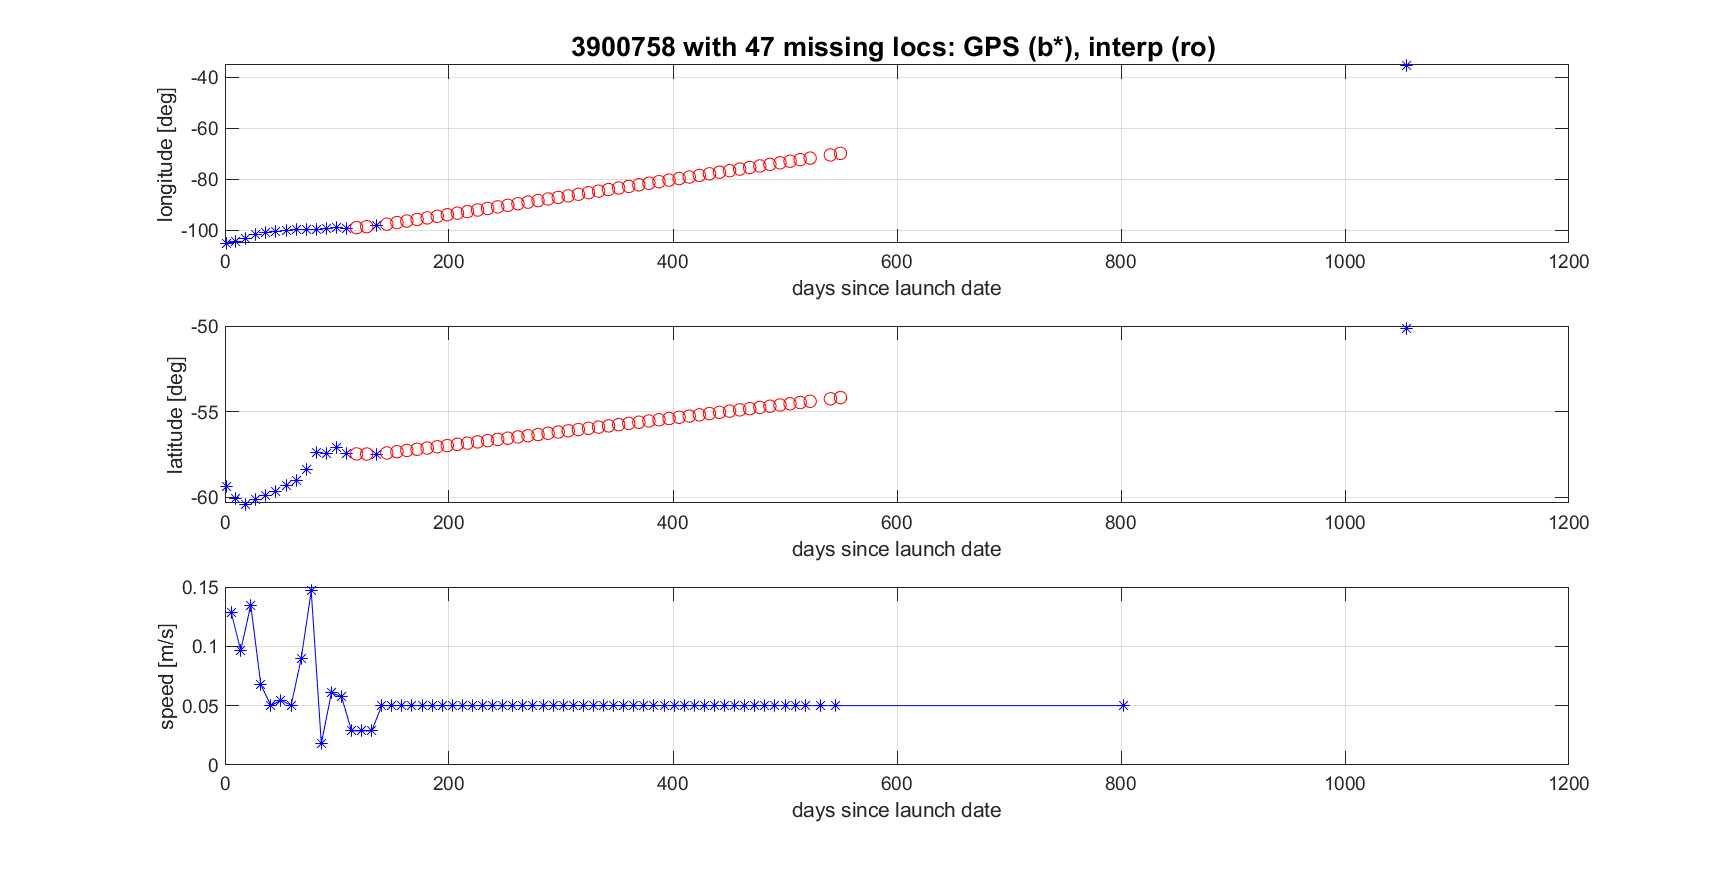
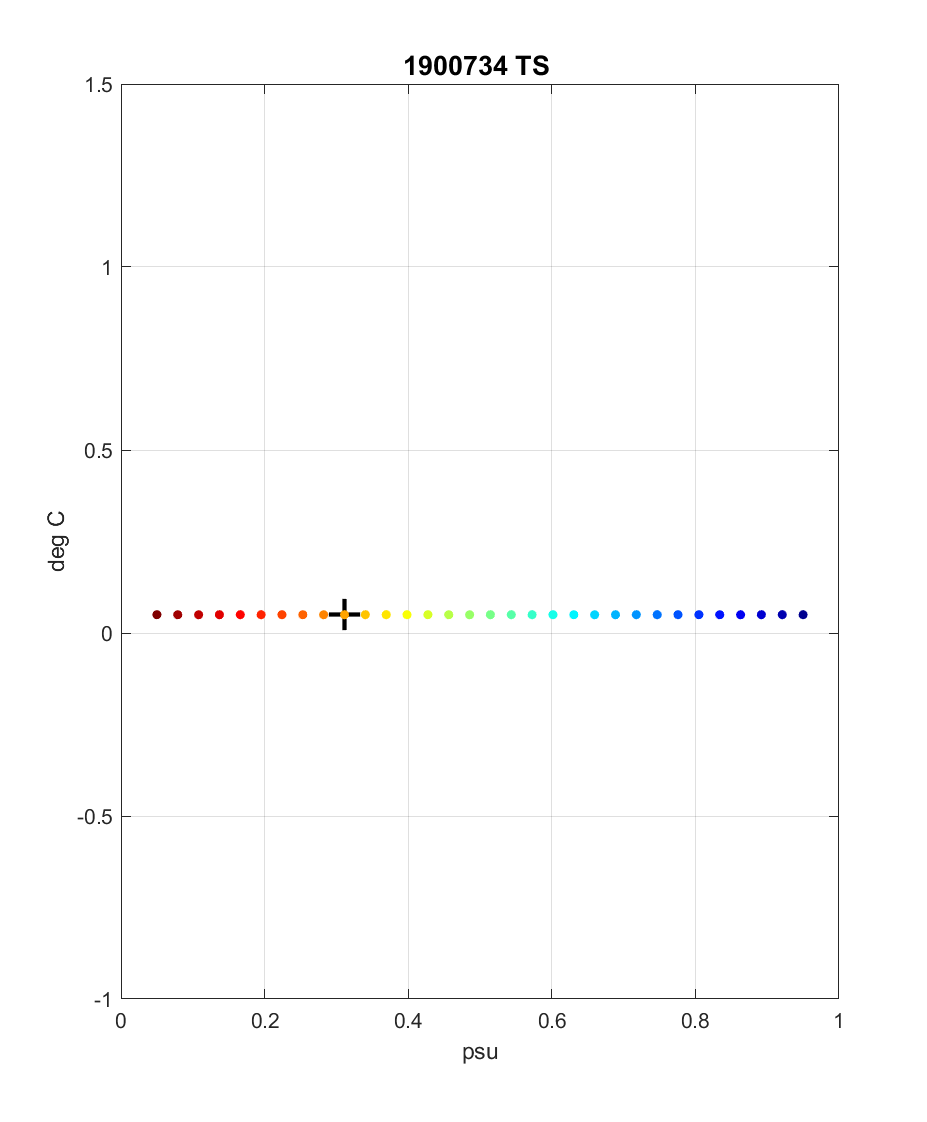
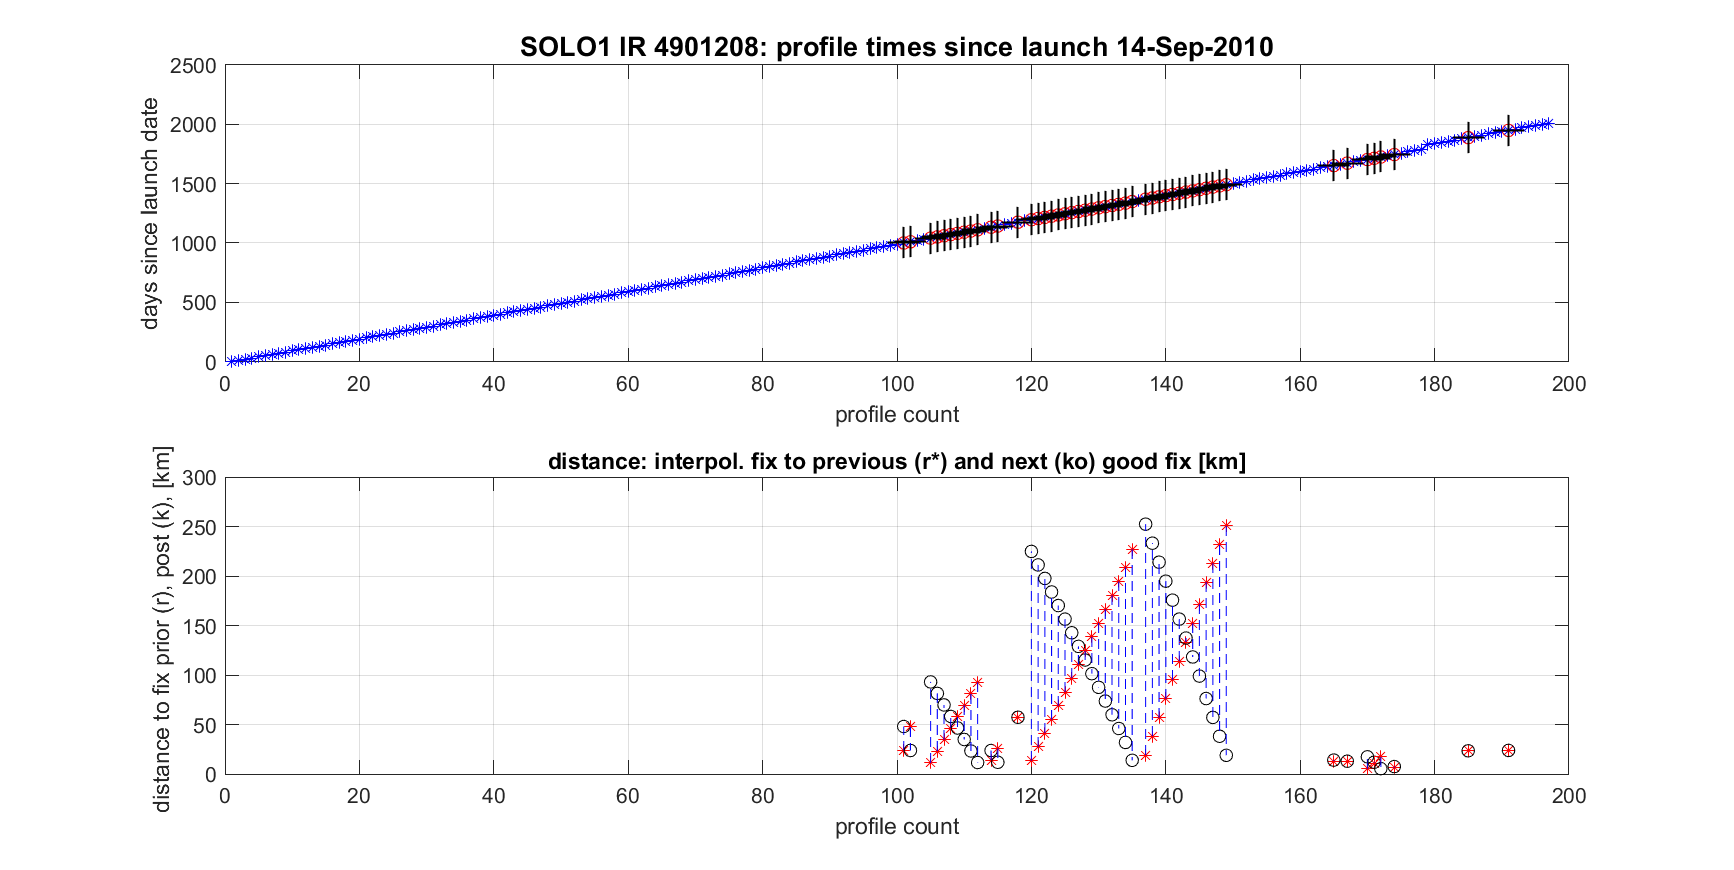
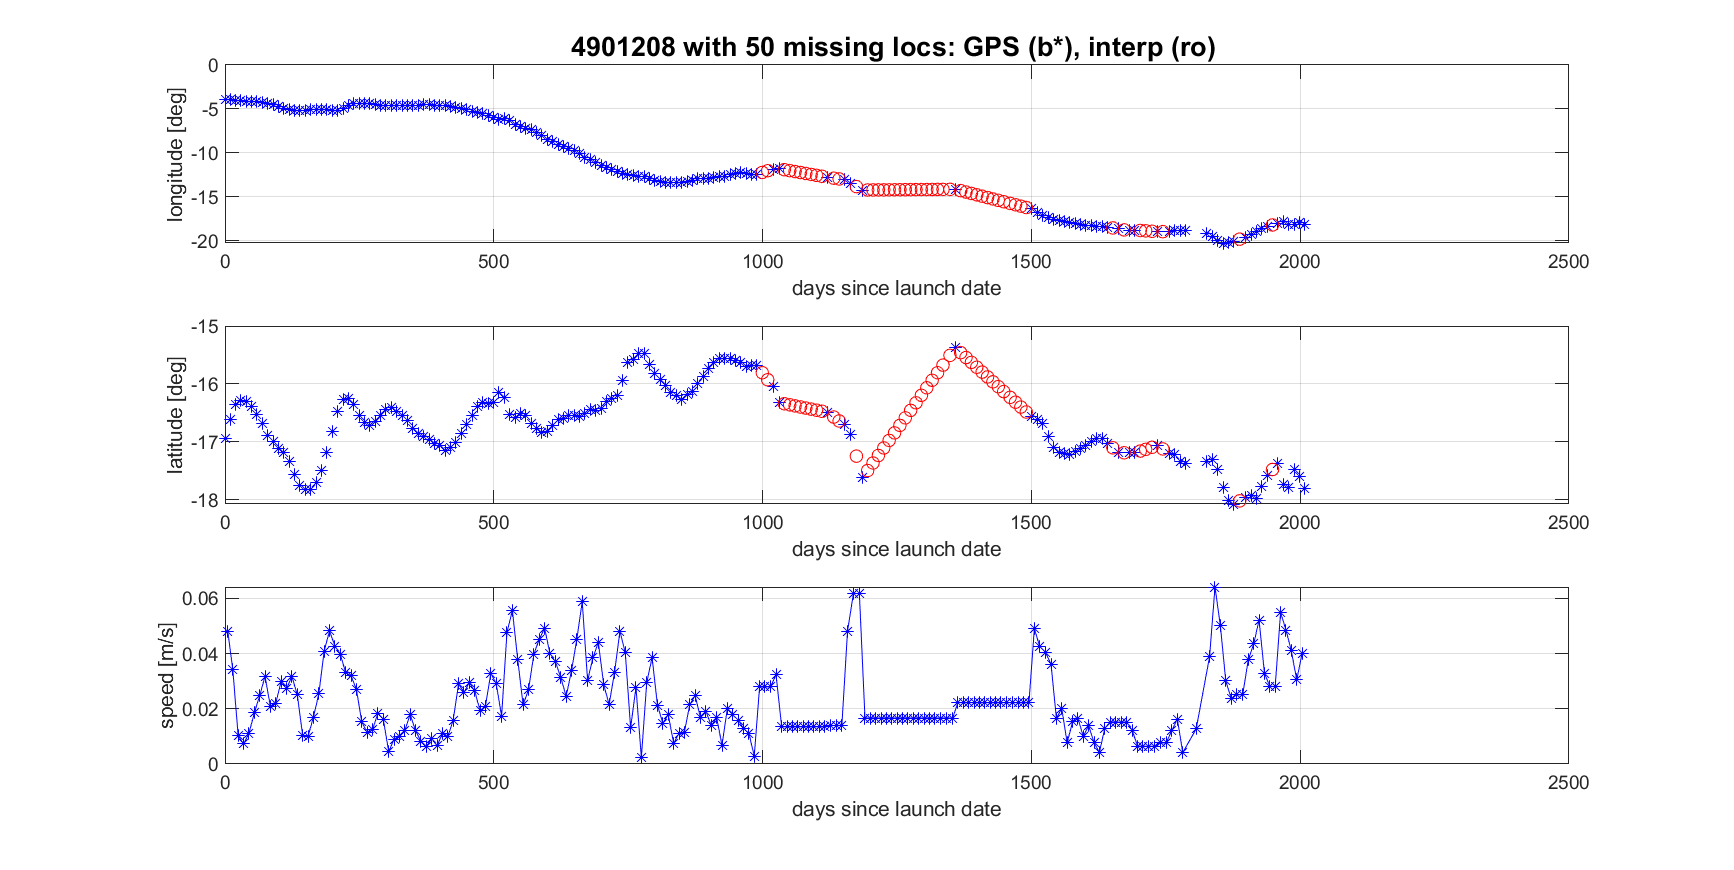
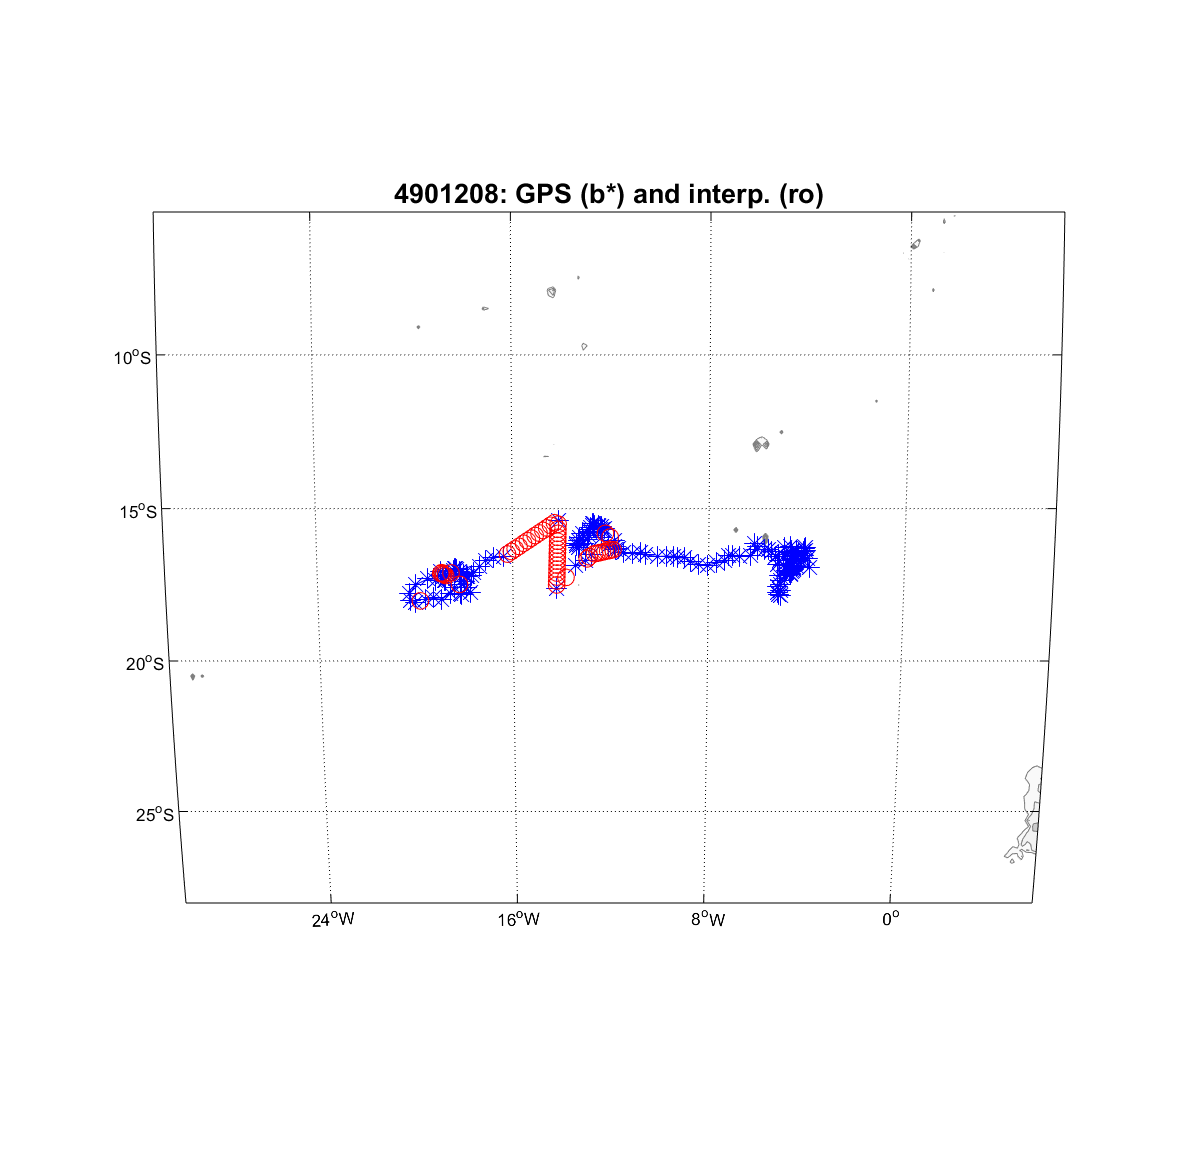
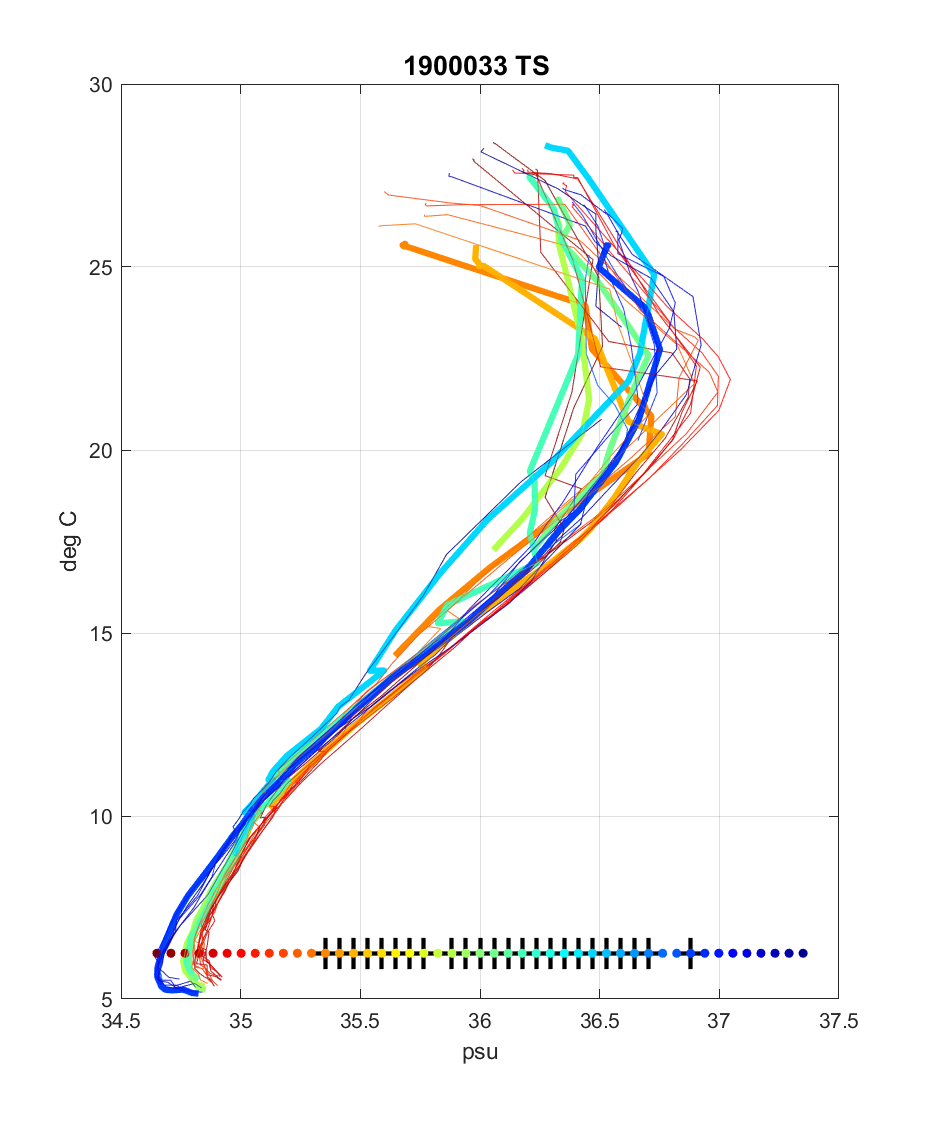
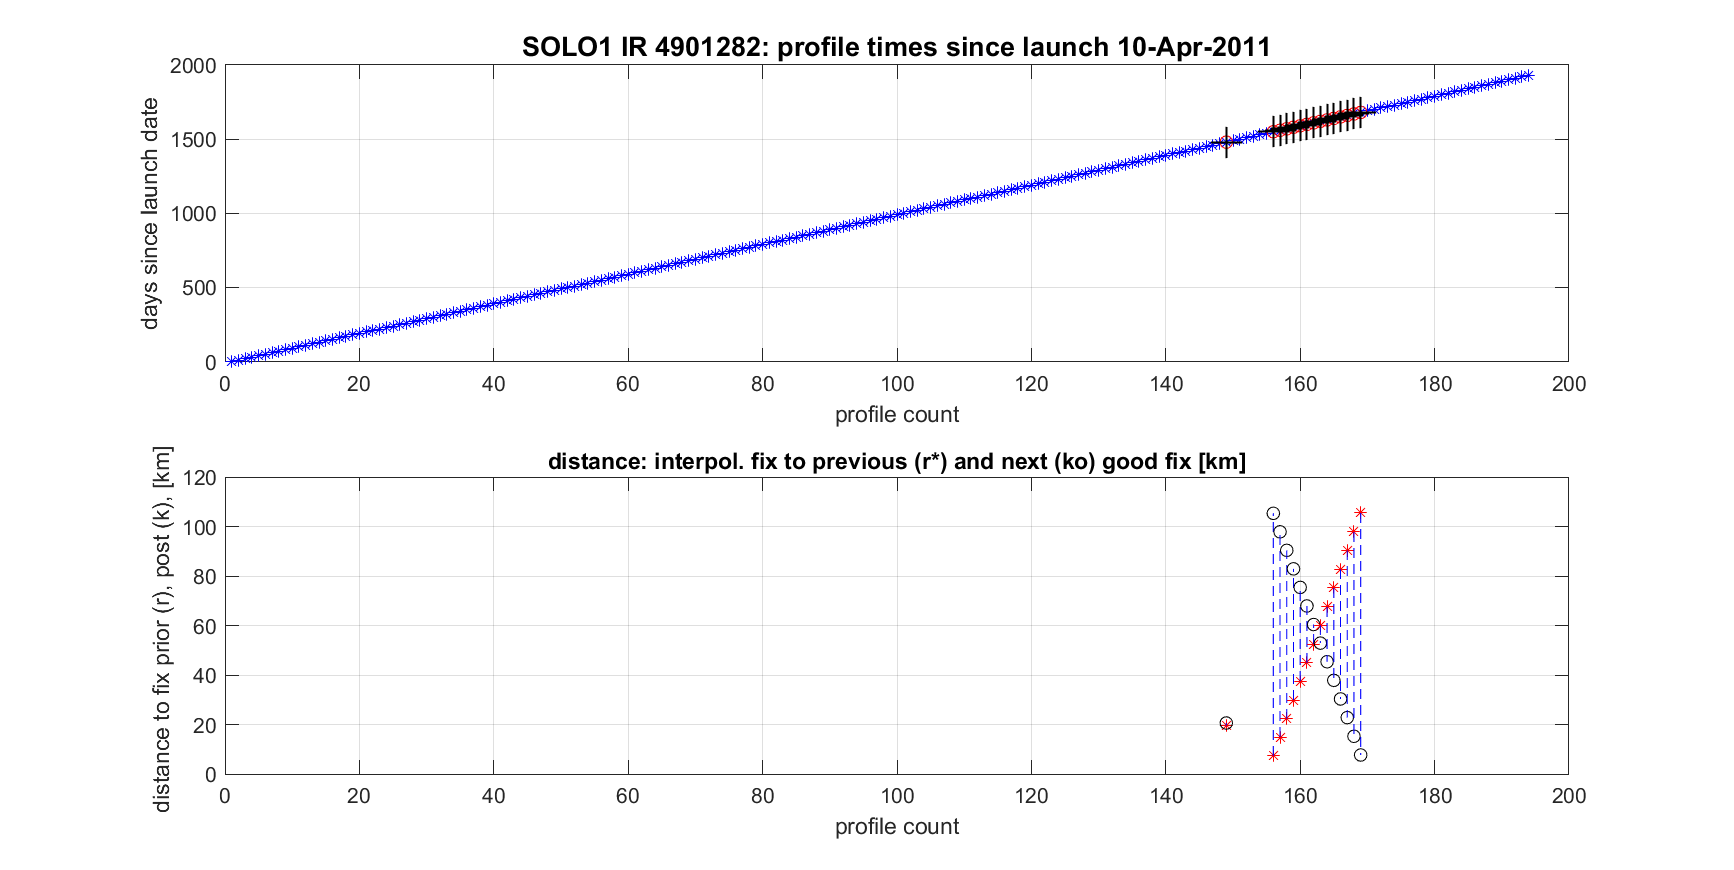
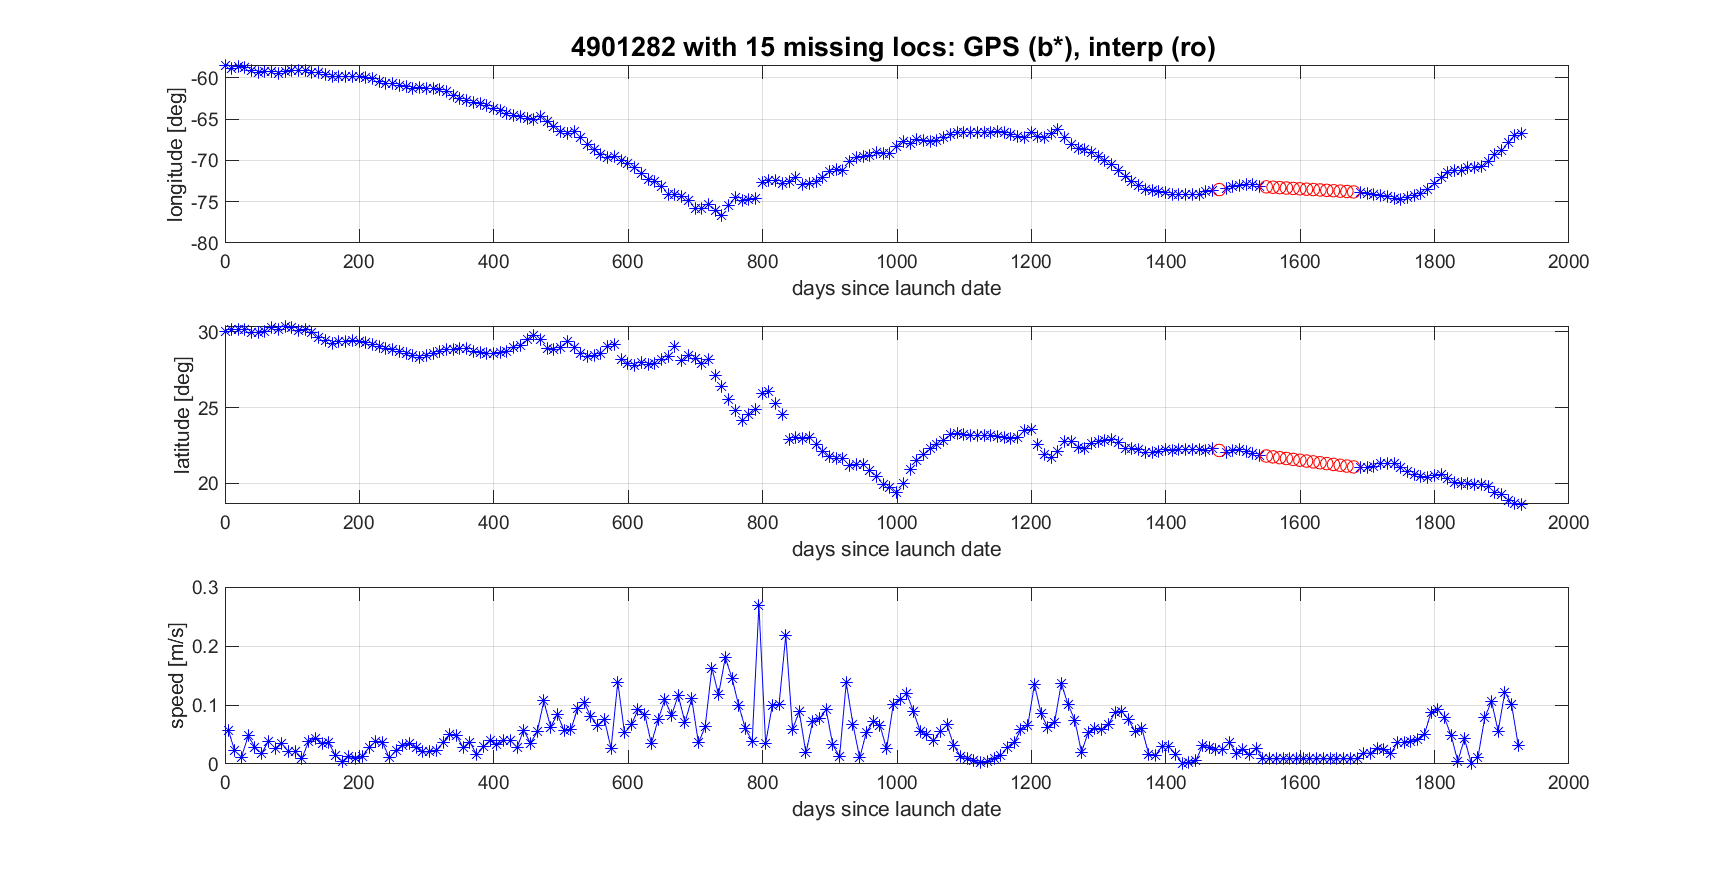
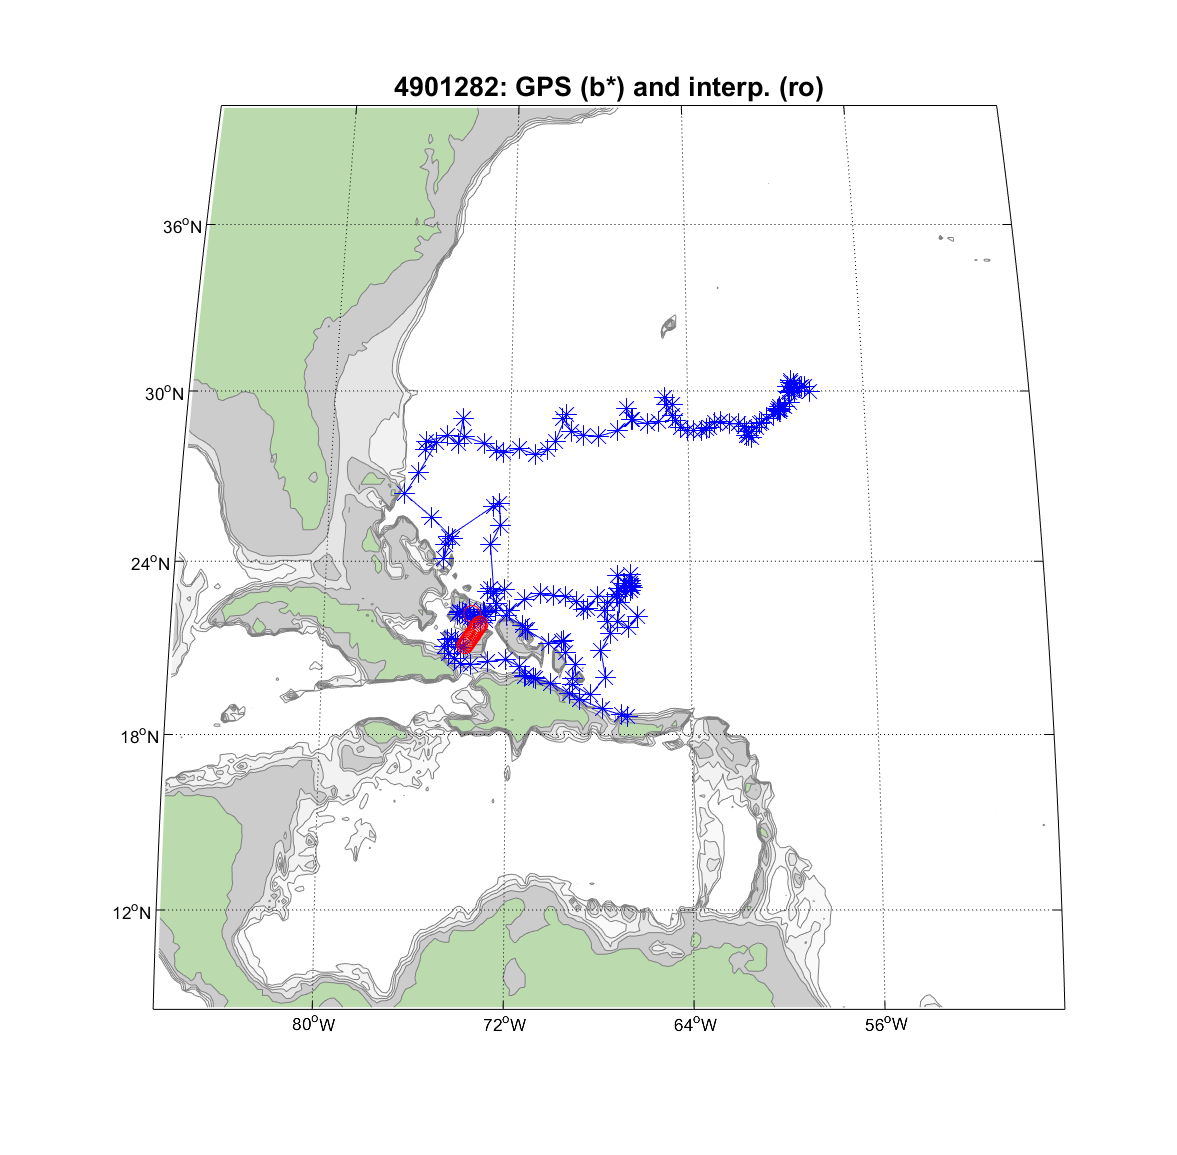
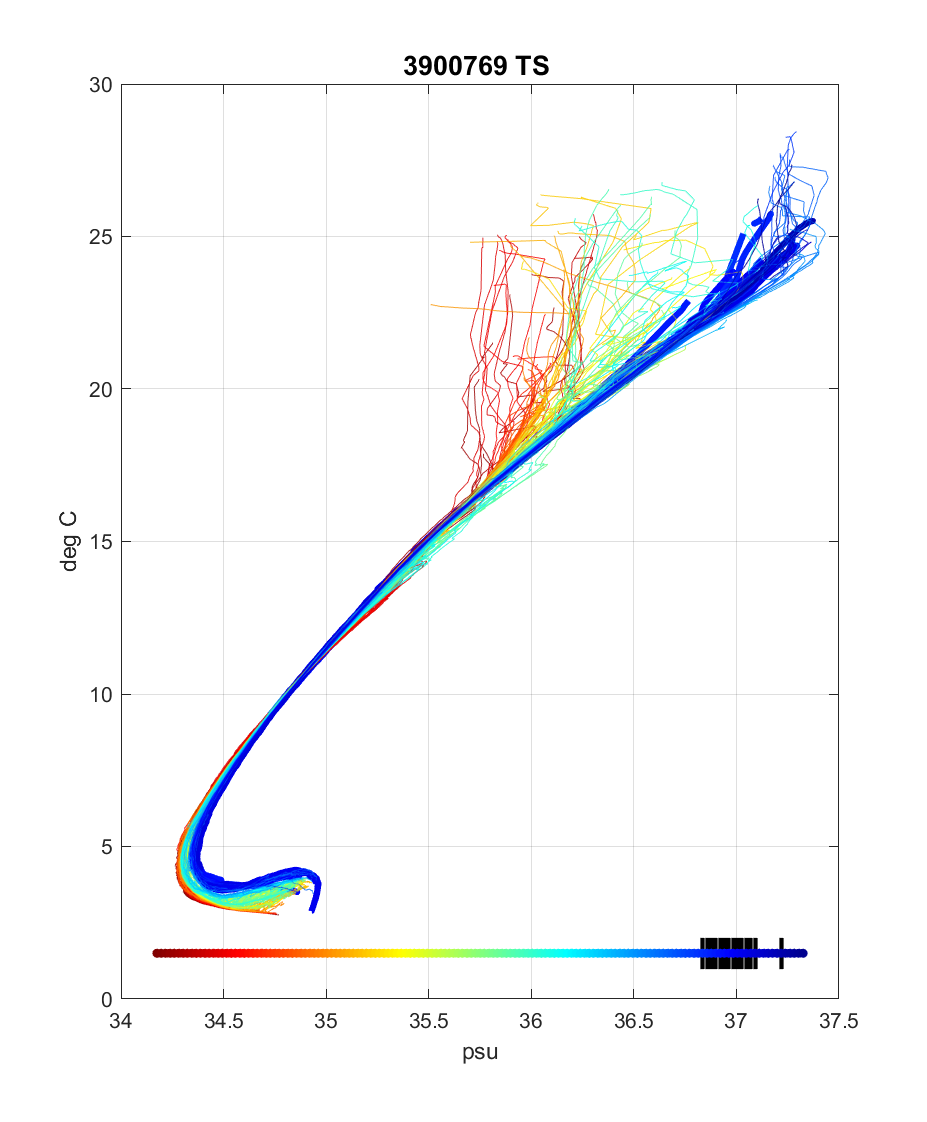
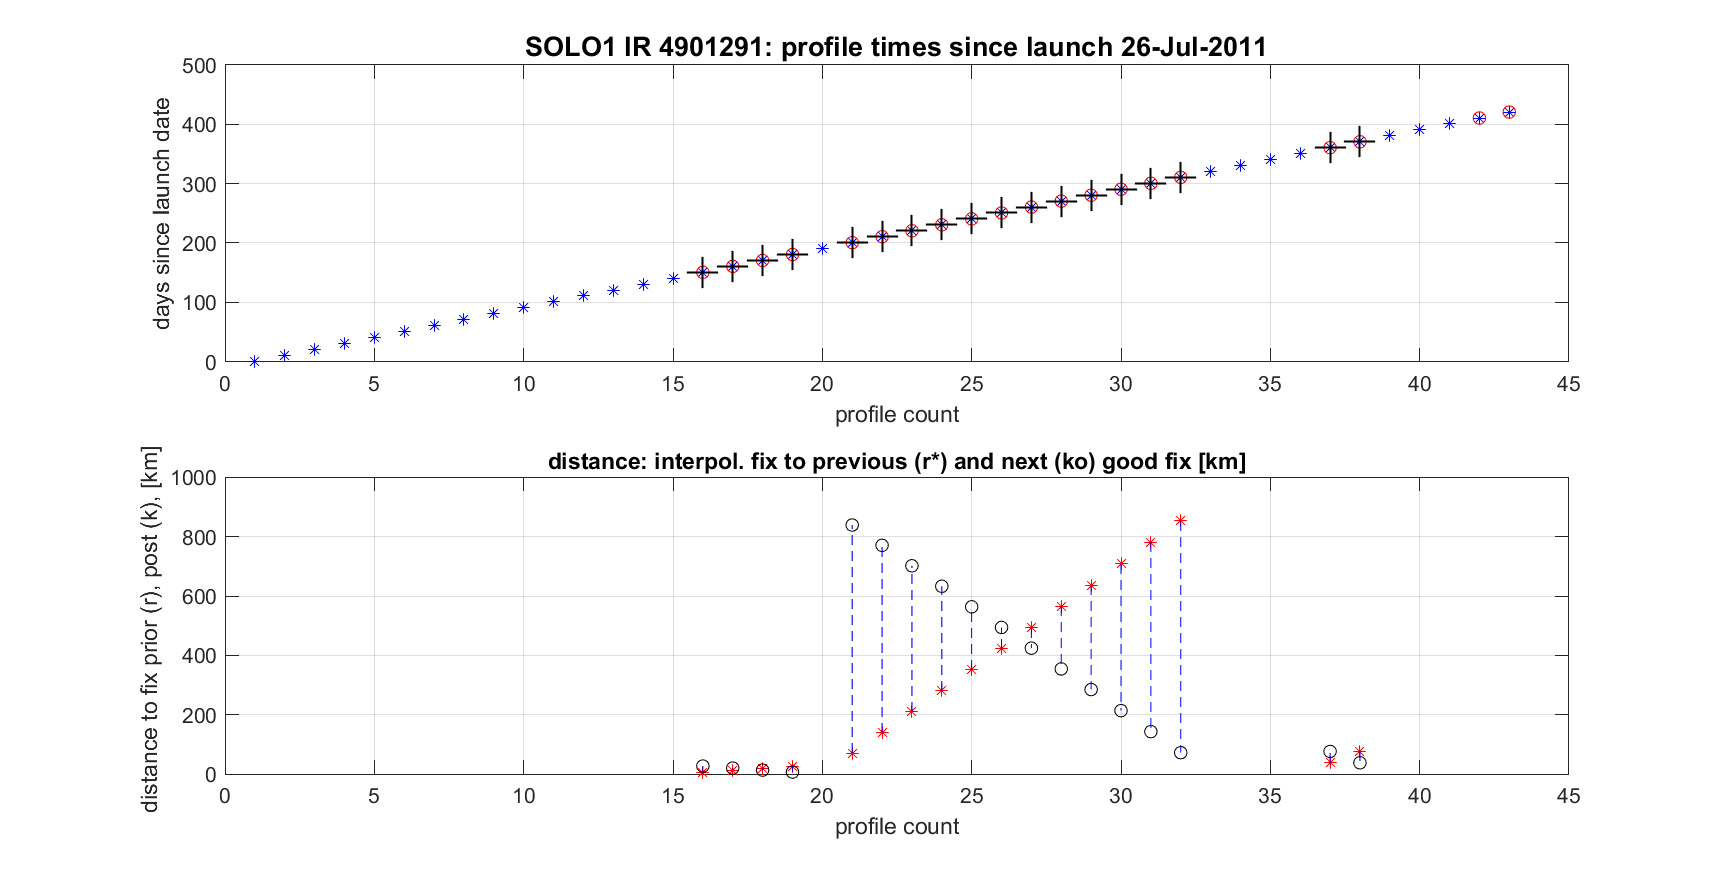
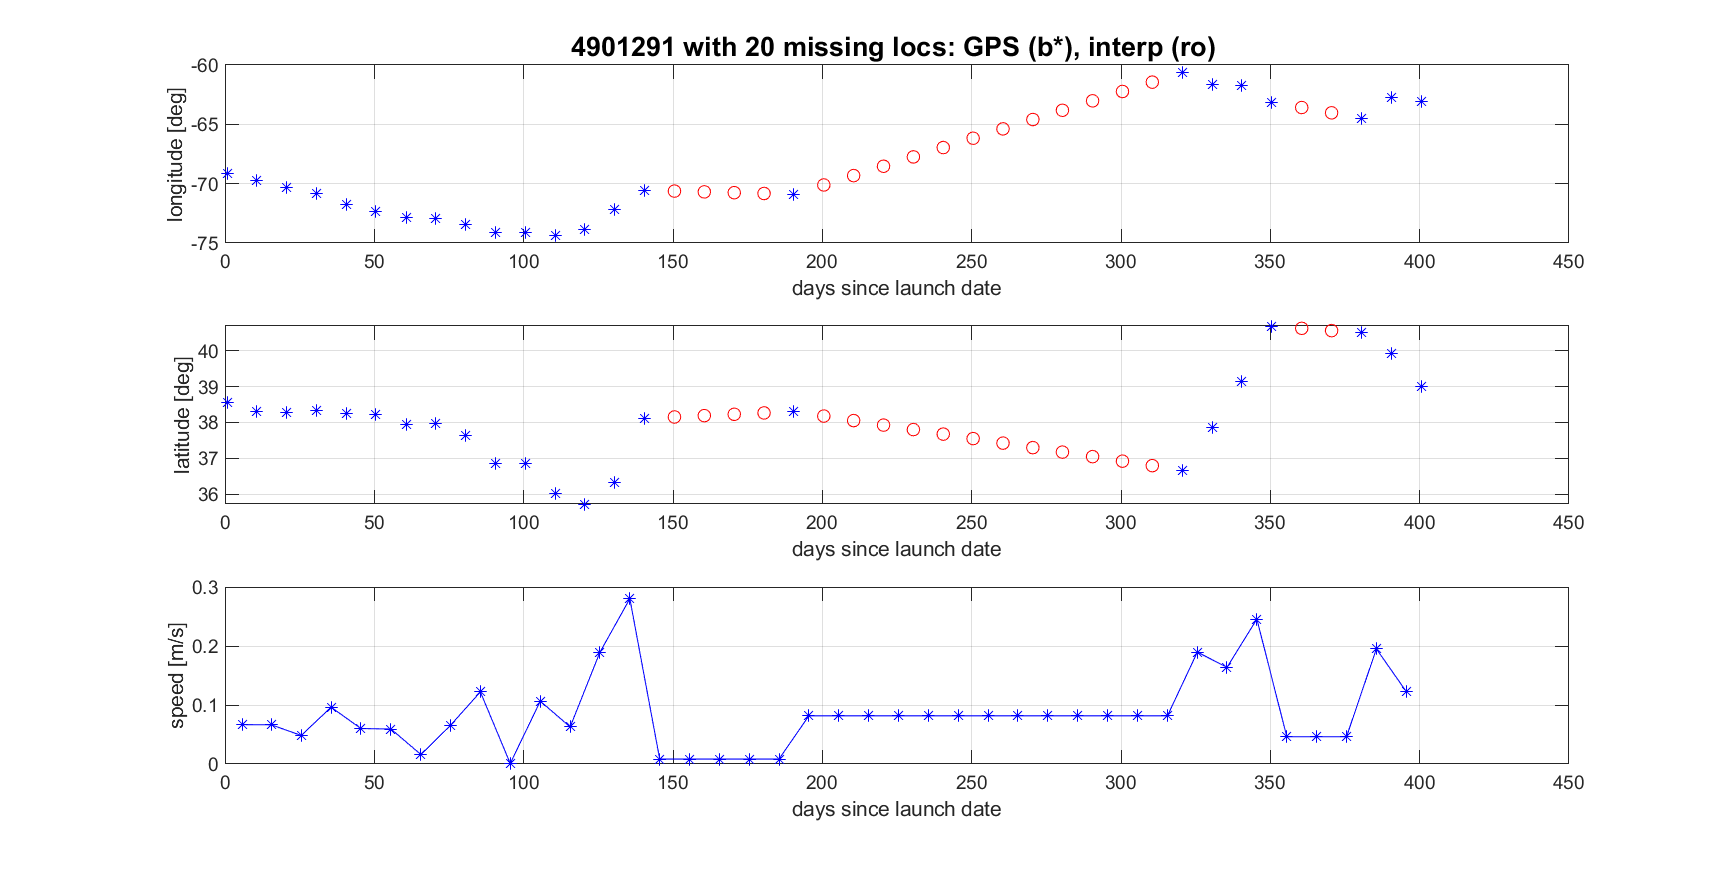
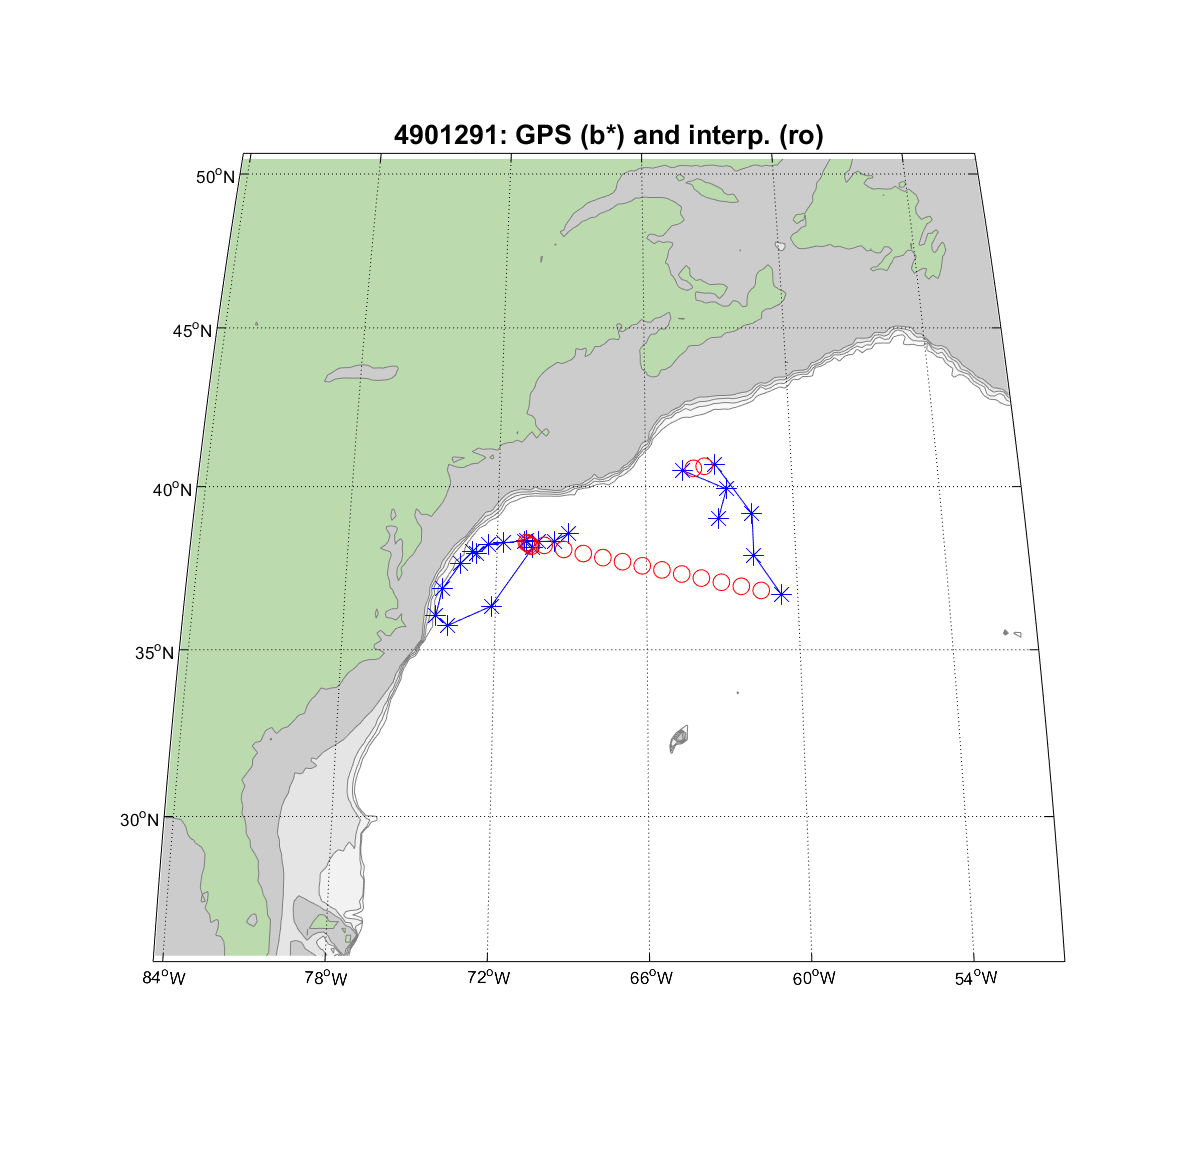
| Cycle times (top) and gap distance (botm) | lon/lat time series, and float speed | map | T profiles, interpolated as thick lines | S profiles, interpolated as thick lines | TS diagram, interpolated as thick lines |
 |
 |
 |
 |
 |
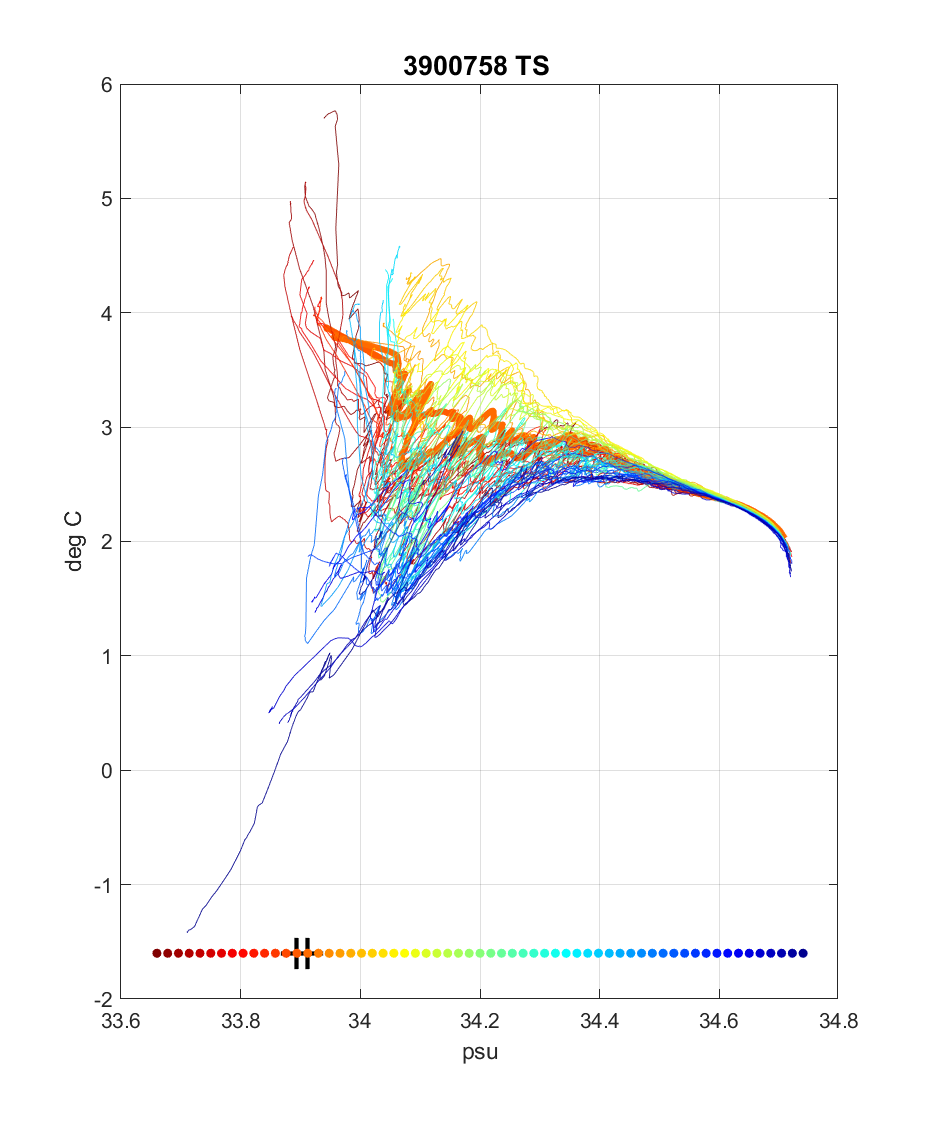 |
| Most of the profiles from 3900758 were sent nearly 2.5 years after the last GPS fix; IR positions from the submission were too far for interpolation: |
|||||
 |
 |
 |
|||
 |
 |
 |
 |
 |
 |
 |
 |
 |
 |
 |
 |
 |
 |
 |
 |
 |
 |
 |
 |
 |
 |
 |
 |
 |
 |
 |
 |
 |
 |
 |
 |
 |
 |
 |
 |
 |
 |
 |
 |
 |
 |
 |
 |
 |
 |
 |
 |
 |
 |
 |
 |
 |
 |