Profile Data
Drift Data
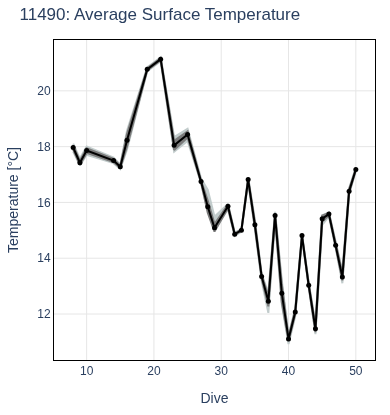
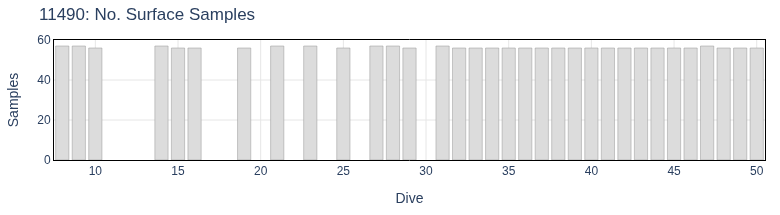
Surface Data
Ascent
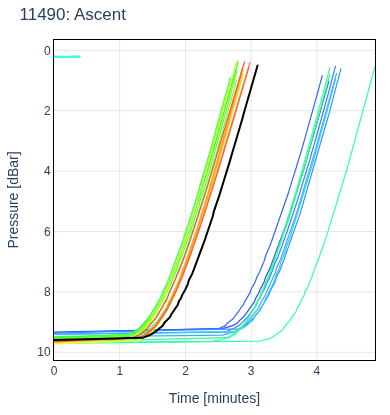

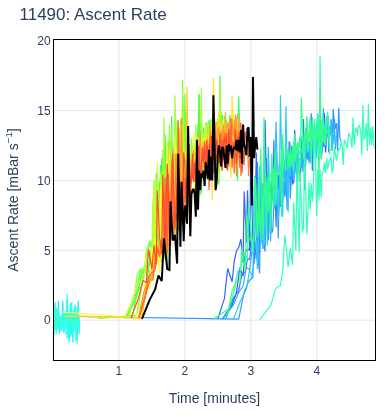
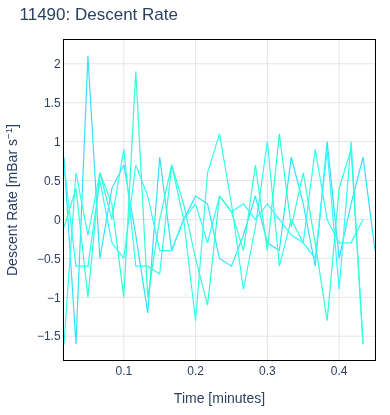
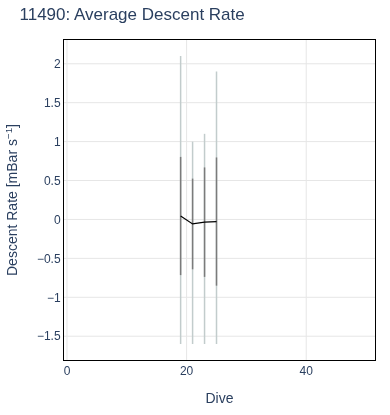
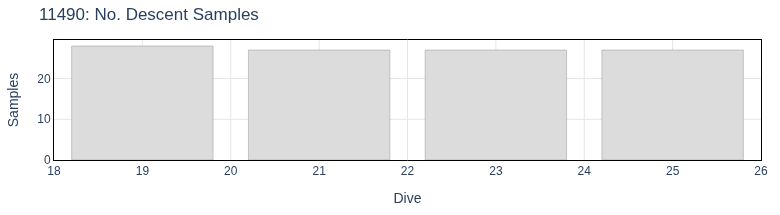
Descent
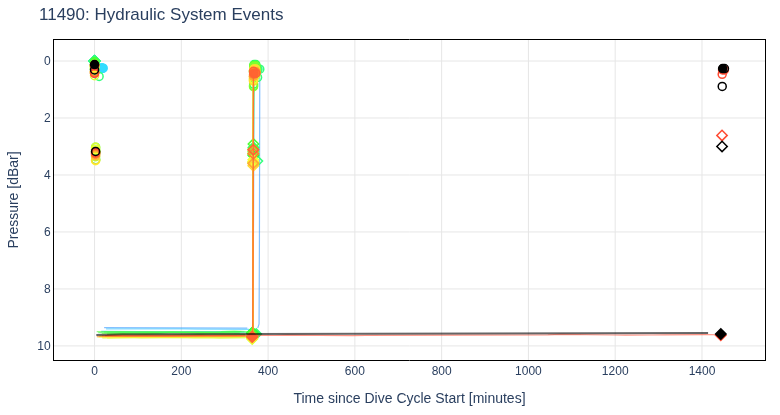
Hydraulic System
Pneumatic System

Diagnostics



Mission
Satcom
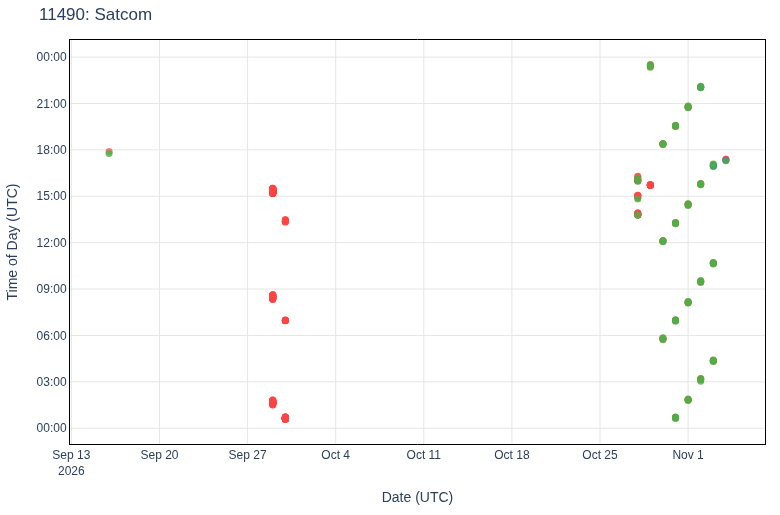
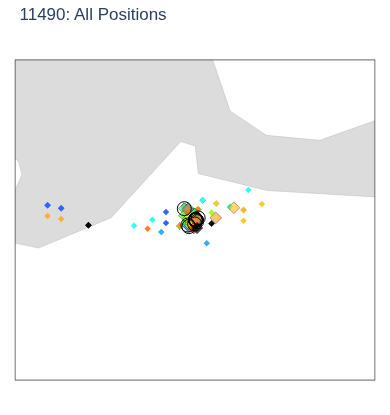
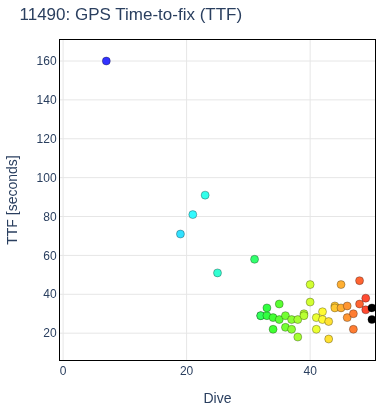
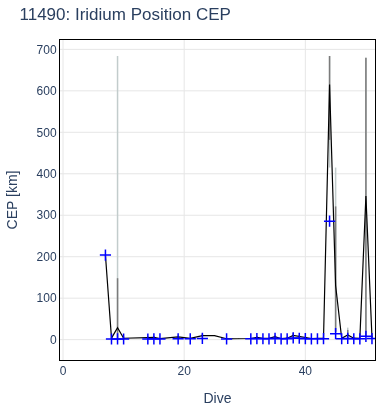
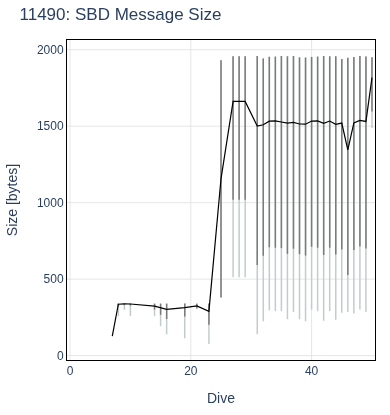
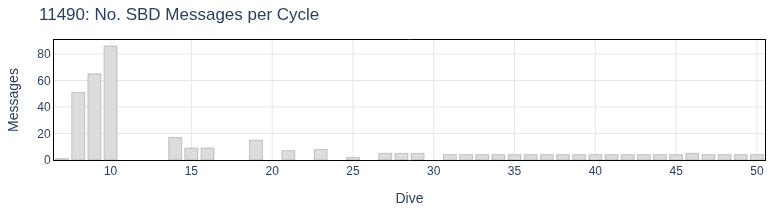
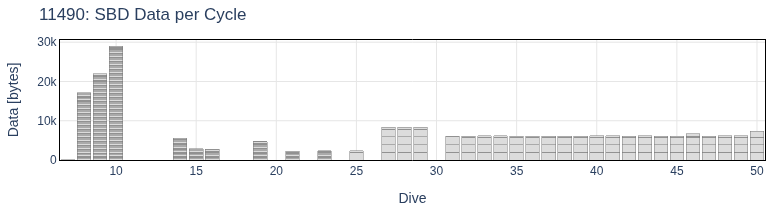
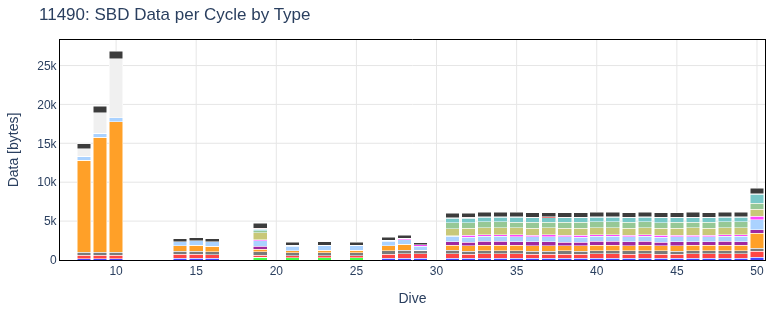

Figure Files
| Title | Category | Files | ||
|---|---|---|---|---|
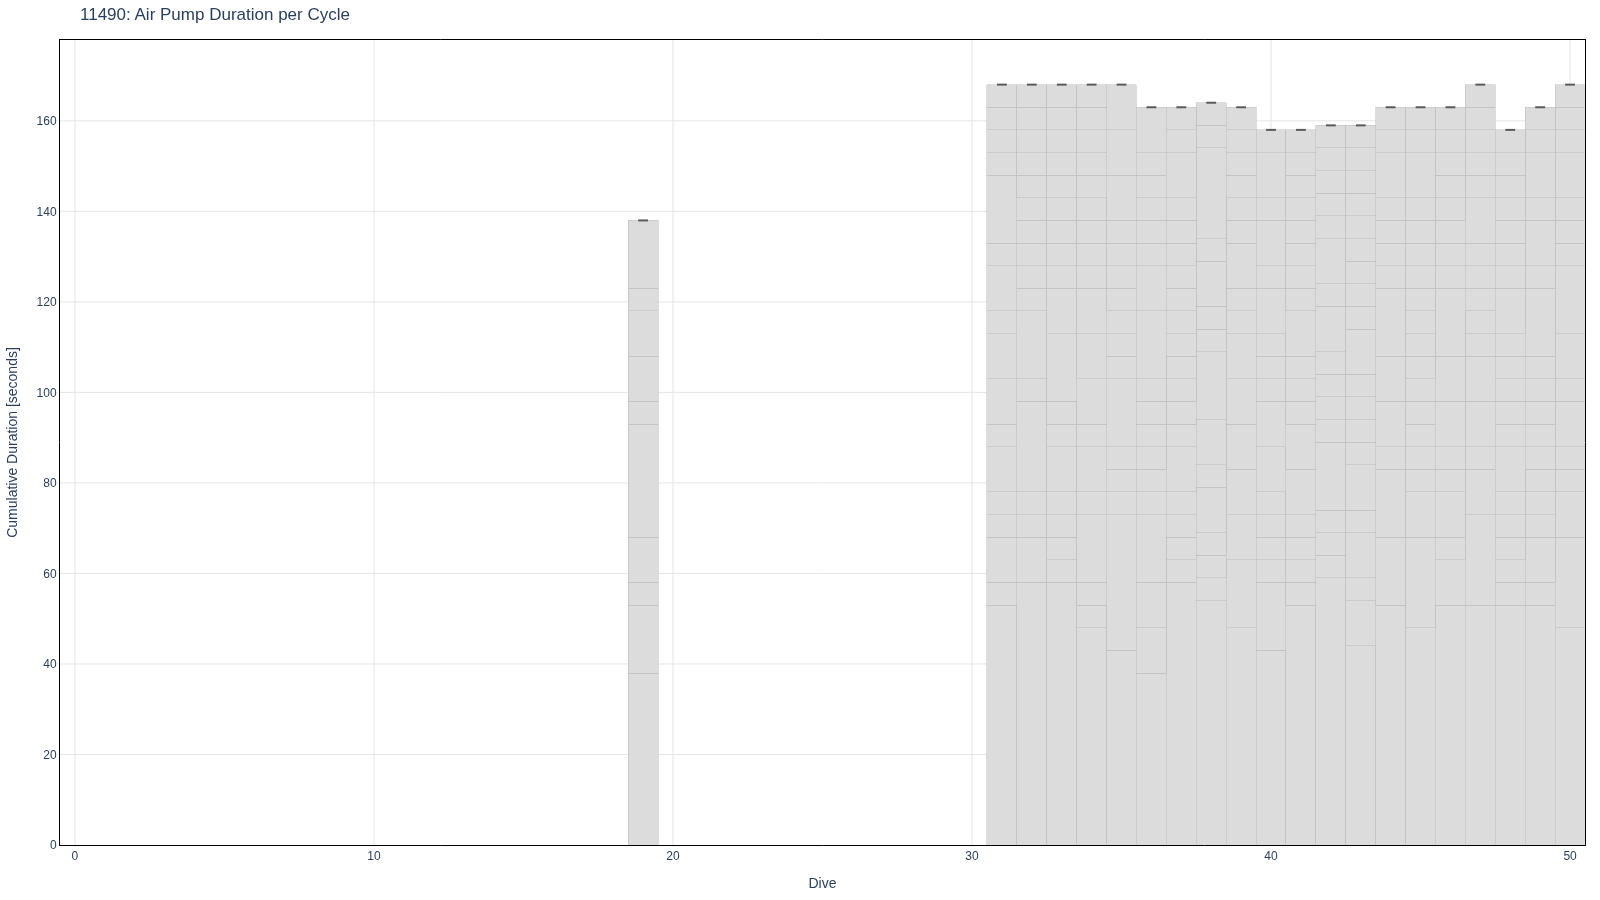
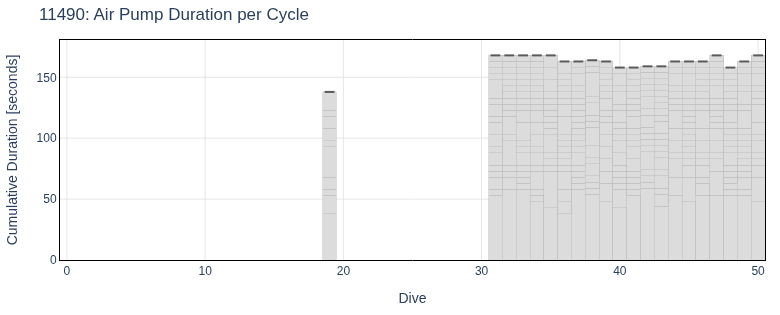
| 1 | Air Pump Duration per Cycle | pneumatic |  | air_pump_duration .html (31.4kB) .png [780x315] (26.0kB) .png [1600x900] (61.8kB) |
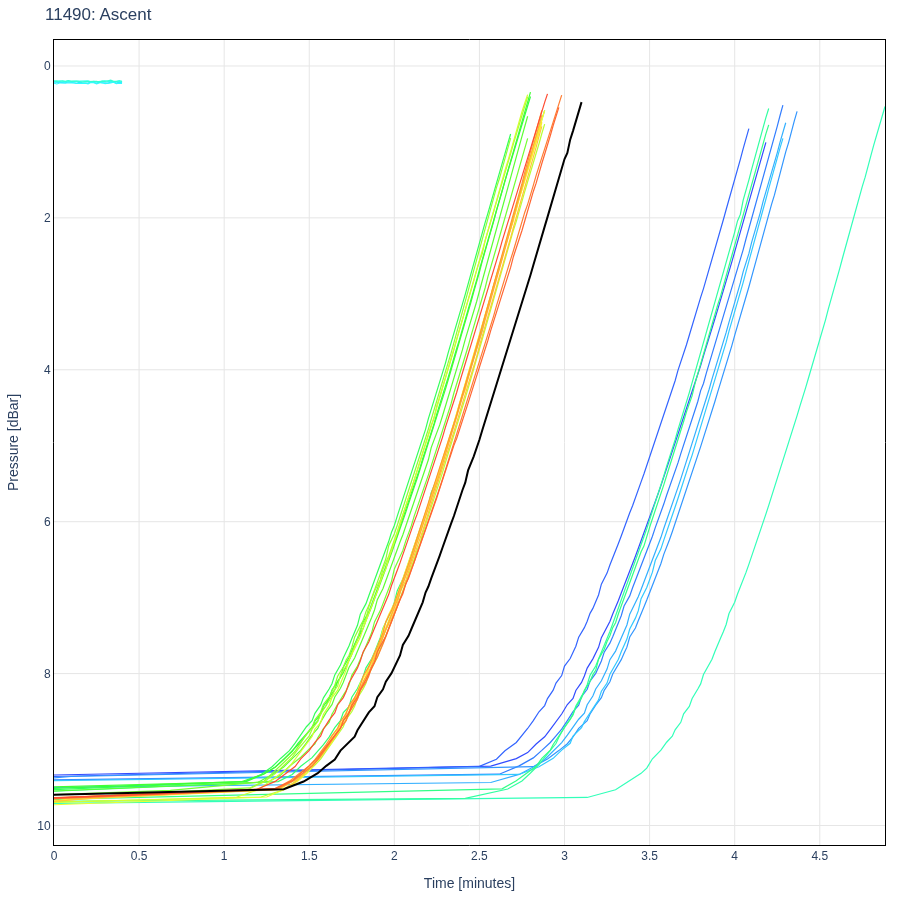
| 2 | Ascent | ascent | 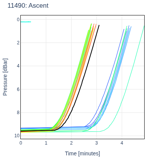 | ascent .html (136.3kB) .png [390x415] (56.4kB) .png [900x900] (194.9kB) |
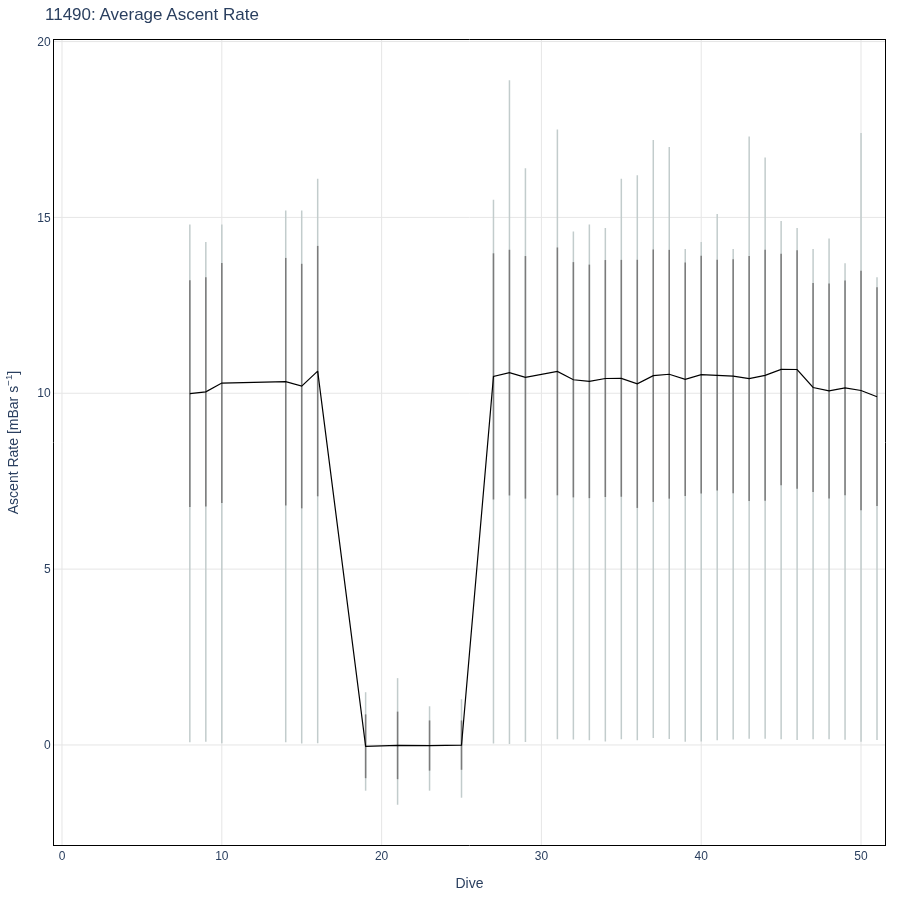
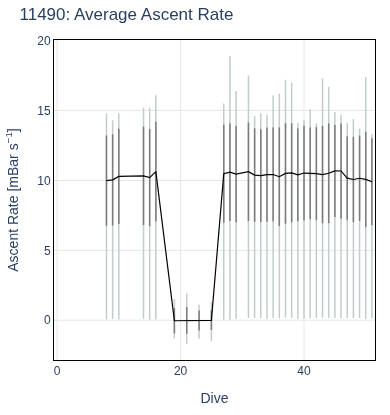
| 3 | Average Ascent Rate | ascent |  | ascent_rate_avg .html (14.1kB) .png [390x415] (36.0kB) .png [900x900] (89.8kB) |
| 4 | Ascent Rate | ascent |  | ascent_rate_v_pres .html (143.9kB) .png [390x415] (97.5kB) .png [900x900] (453.6kB) |
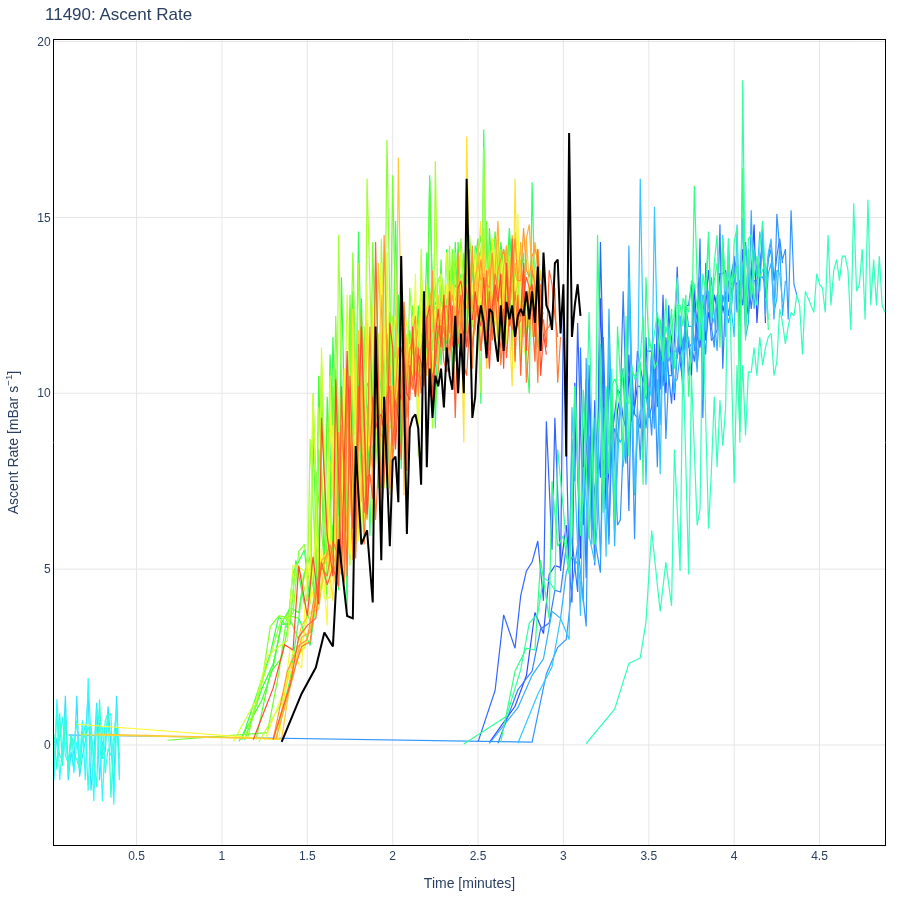
| 5 | Ascent Rate | ascent | 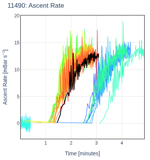 | ascent_rate_v_time .html (170.7kB) .png [390x415] (71.7kB) .png [900x900] (311.1kB) |
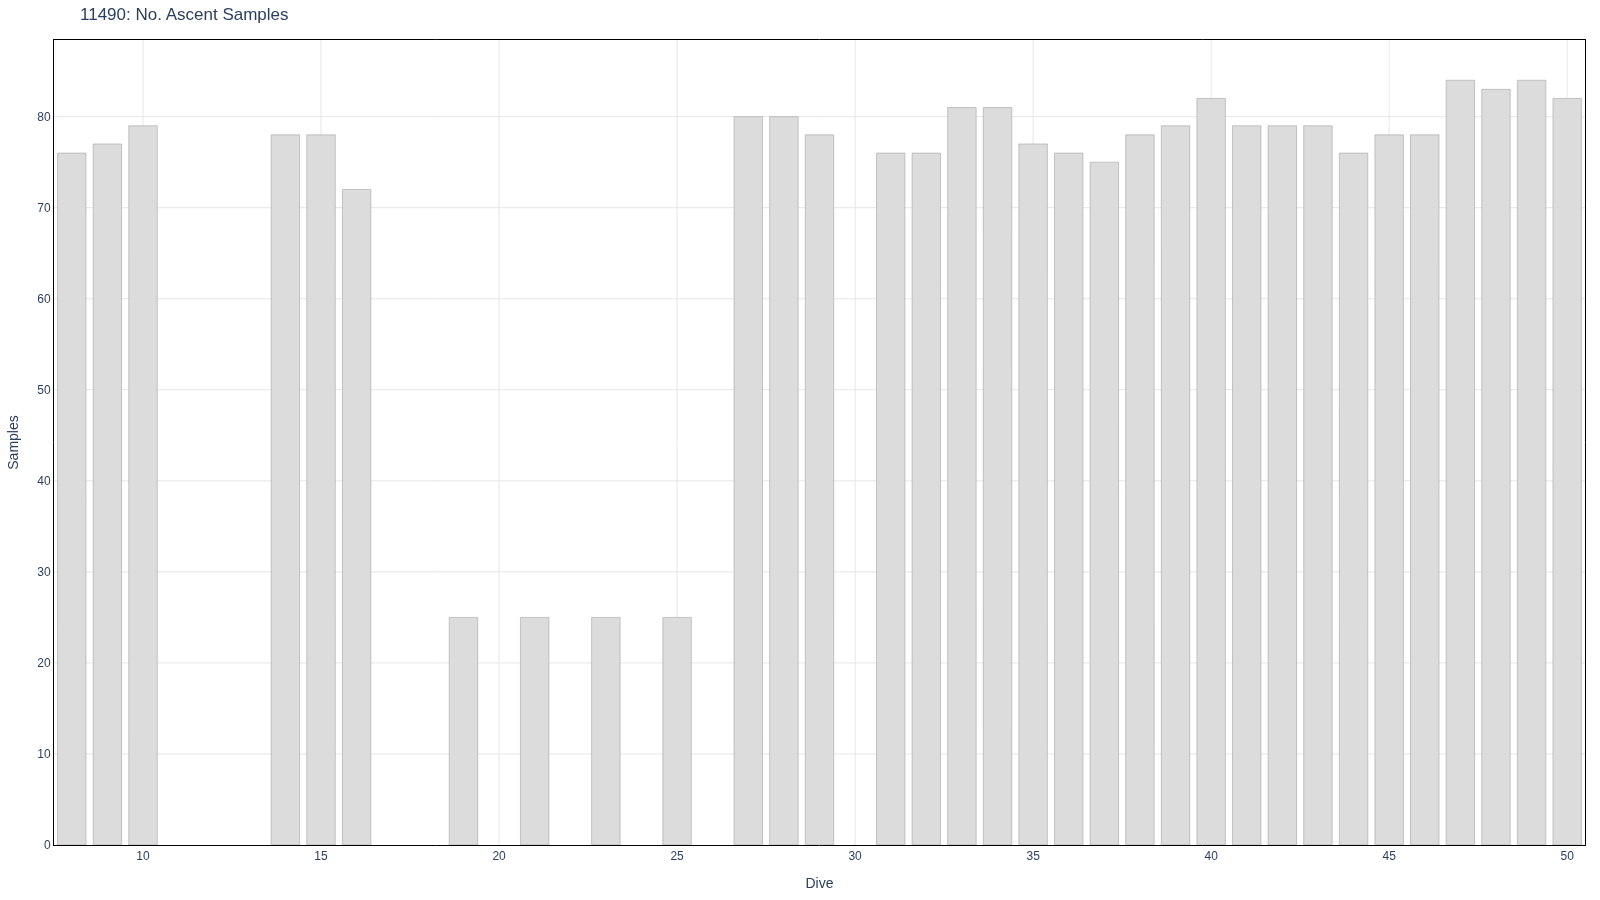
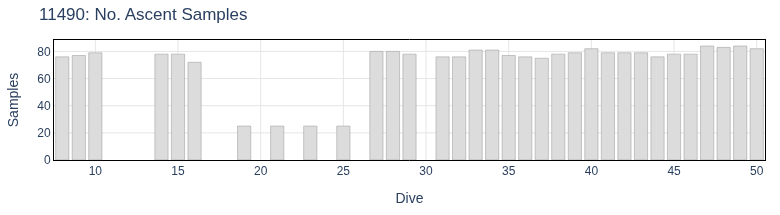
| 6 | No. Ascent Samples | ascent | 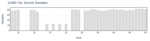 | ascent_sample_count .html (8.6kB) .png [780x215] (21.4kB) .png [1600x900] (57.4kB) |
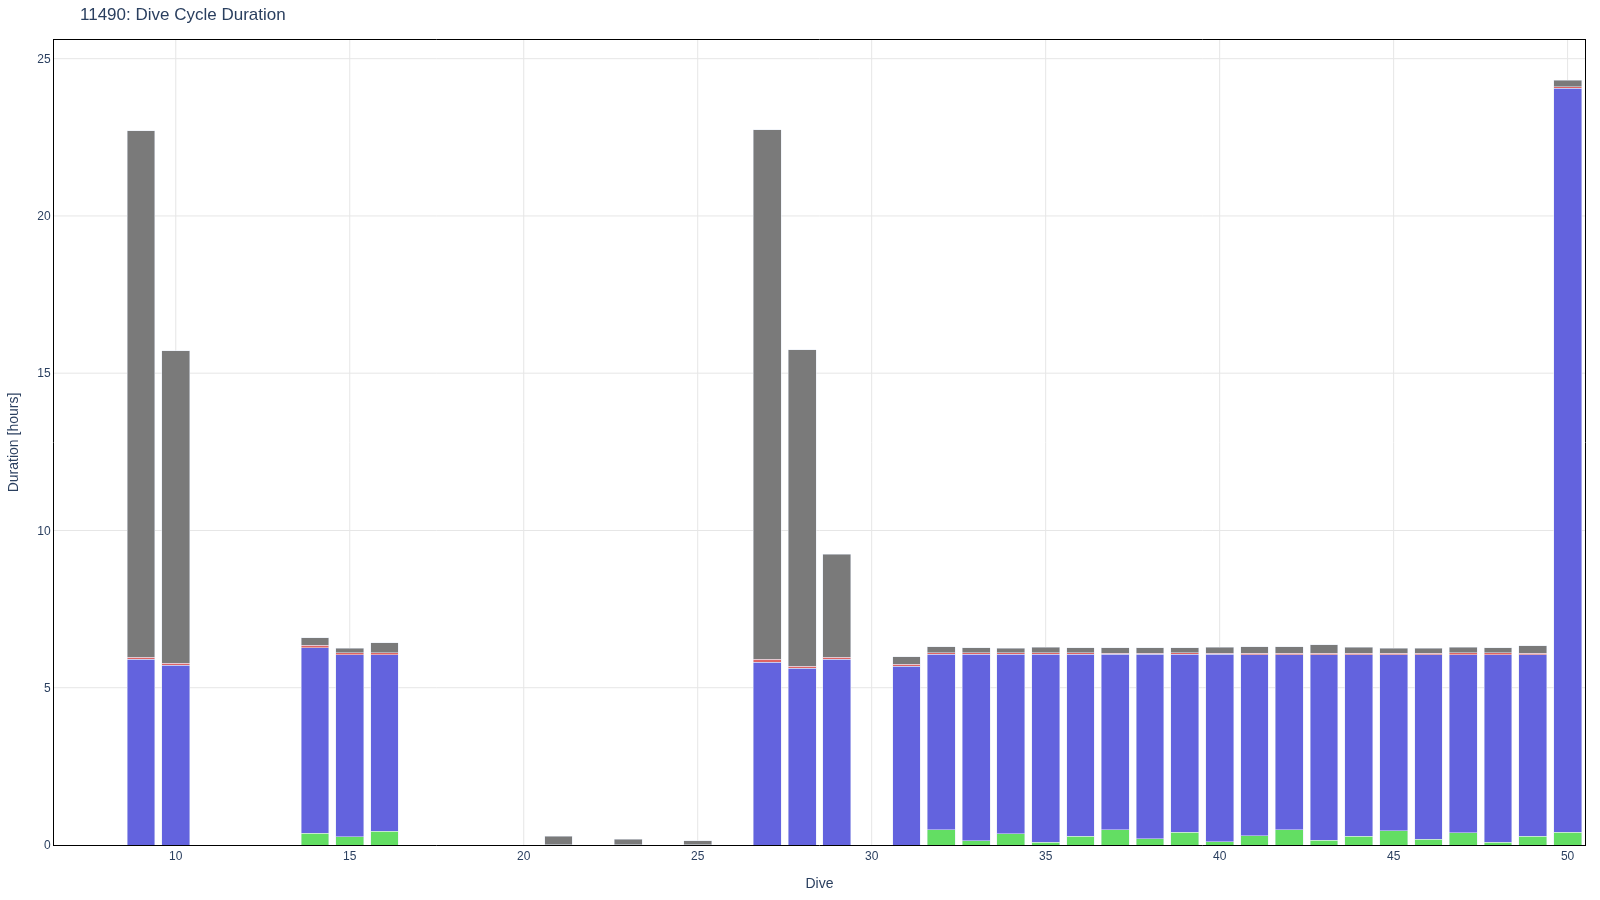
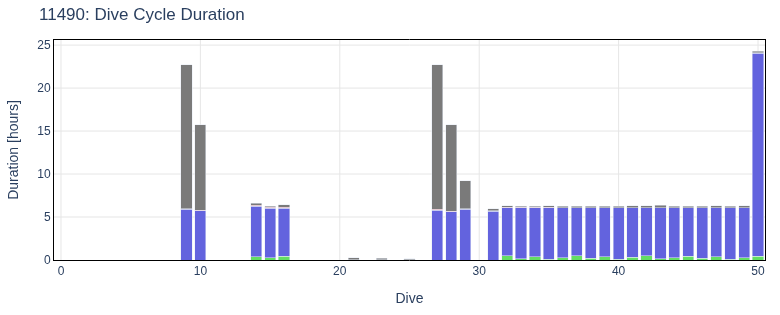
| 7 | Dive Cycle Duration | cycle_timing | 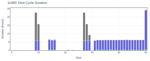 | cycle_timing .html (11.1kB) .png [780x315] (21.6kB) .png [1600x900] (48.4kB) |
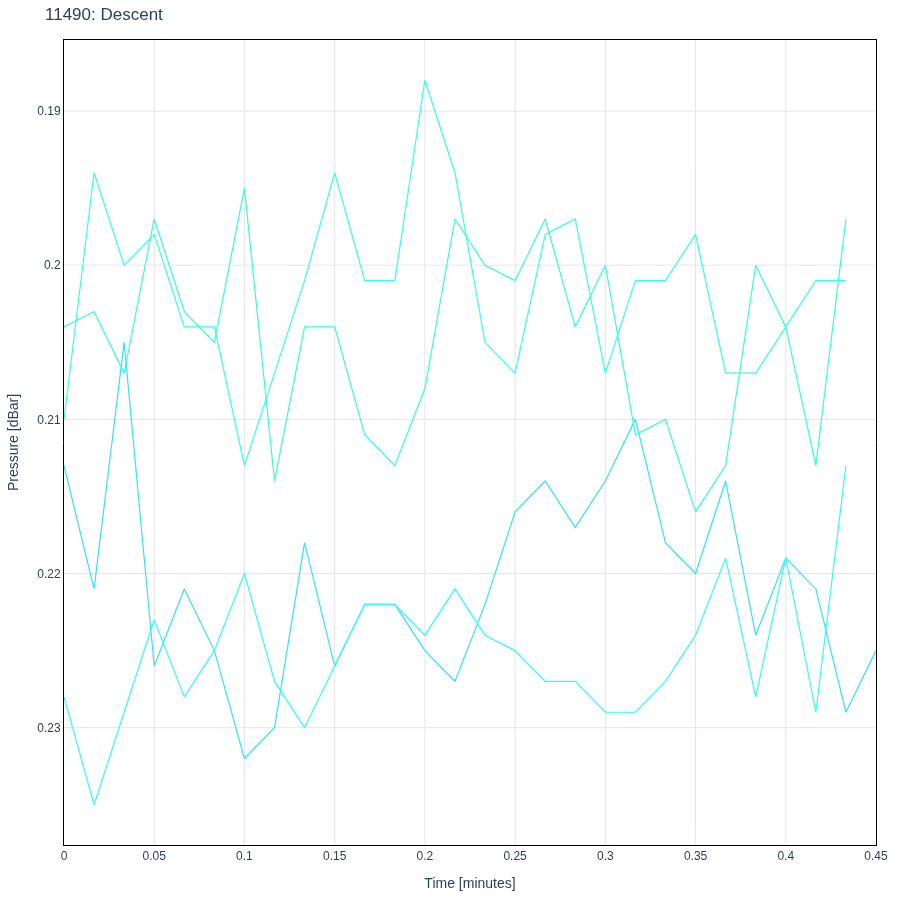
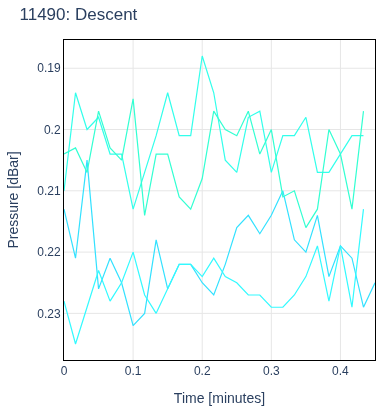
| 8 | Descent | descent | 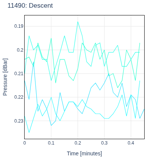 | descent .html (15.9kB) .png [390x415] (48.8kB) .png [900x900] (124.2kB) |
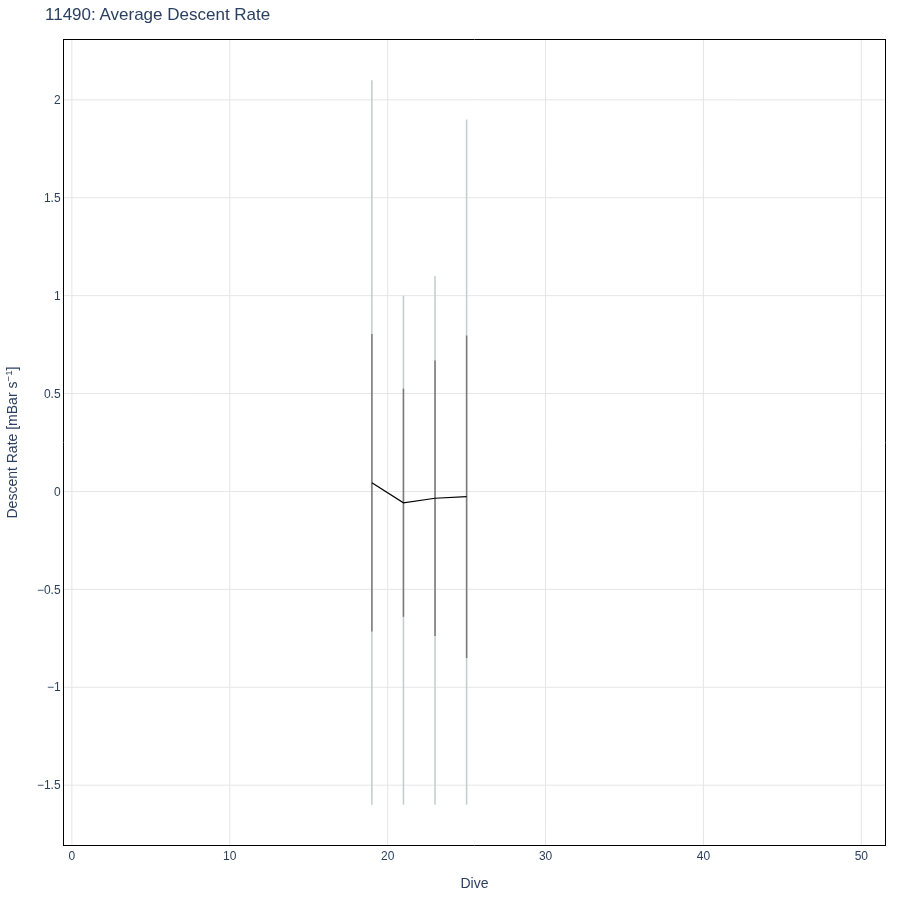
| 9 | Average Descent Rate | descent | 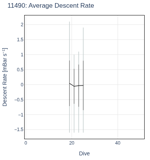 | descent_rate_avg .html (9.8kB) .png [390x415] (27.4kB) .png [900x900] (61.5kB) |
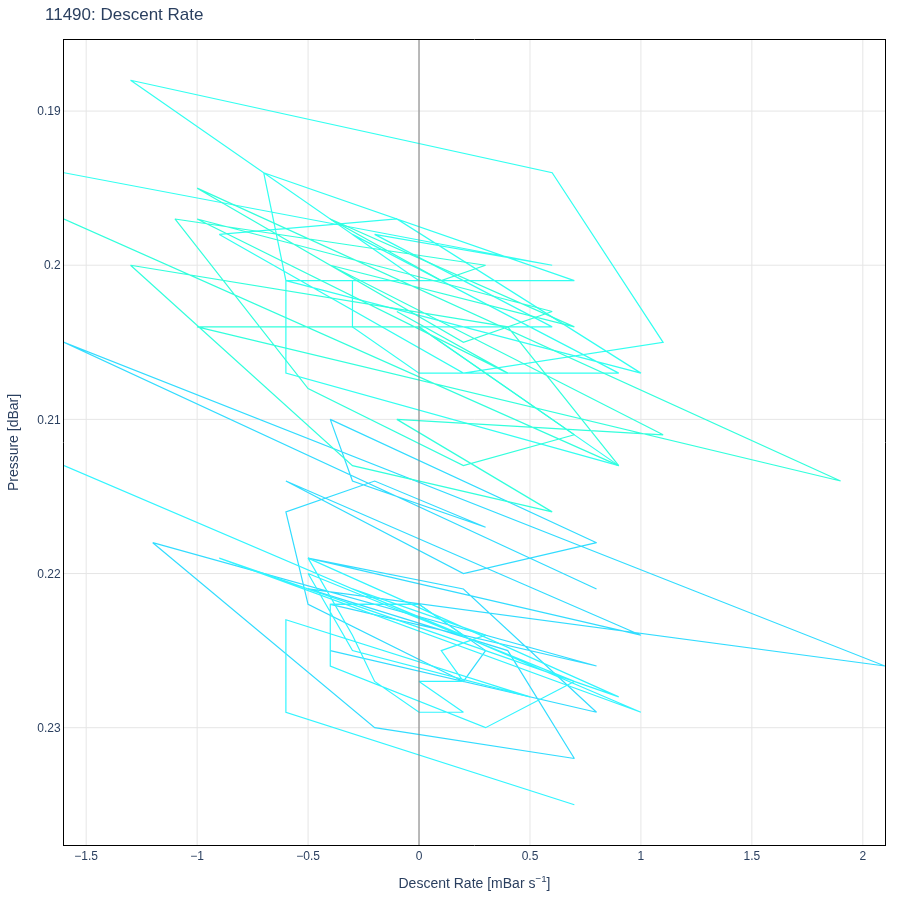
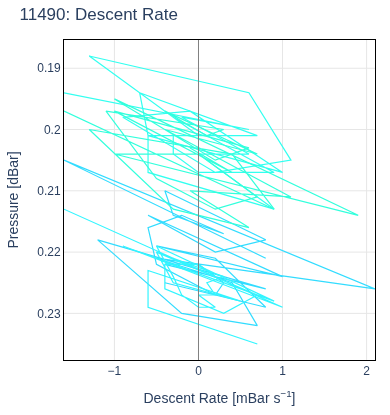
| 10 | Descent Rate | descent |  | descent_rate_v_pres .html (16.3kB) .png [390x415] (71.2kB) .png [900x900] (210.7kB) |
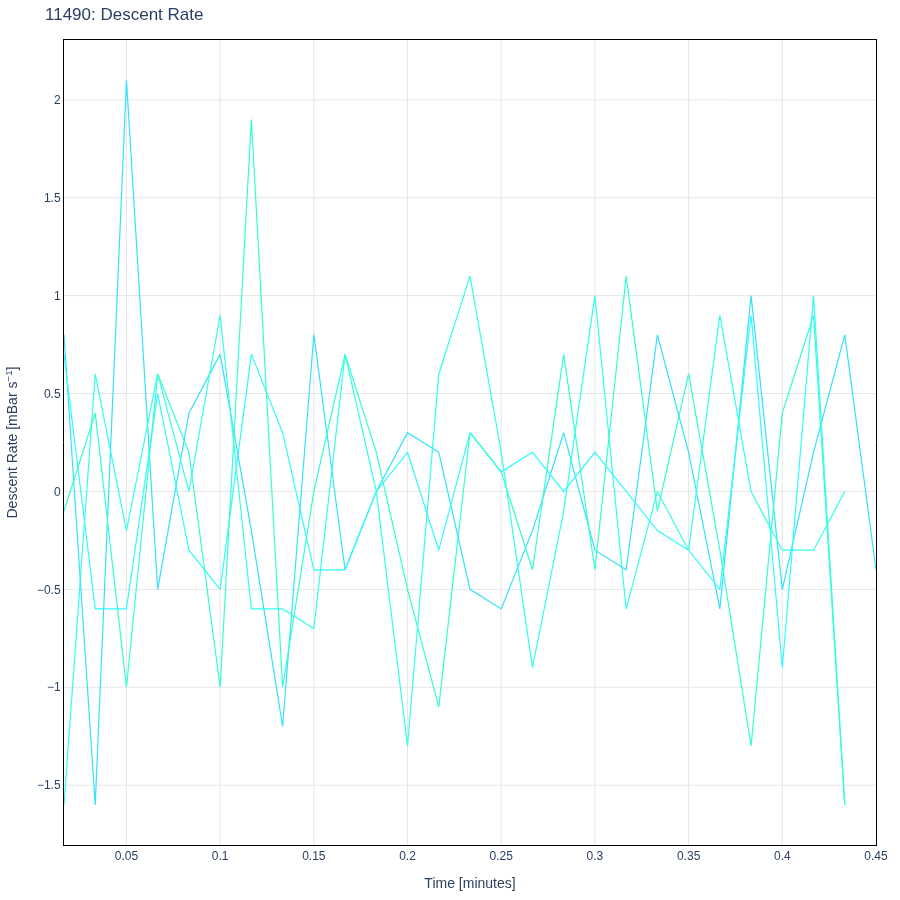
| 11 | Descent Rate | descent | 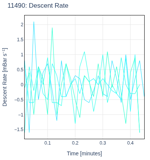 | descent_rate_v_time .html (17.4kB) .png [390x415] (65.7kB) .png [900x900] (177.4kB) |
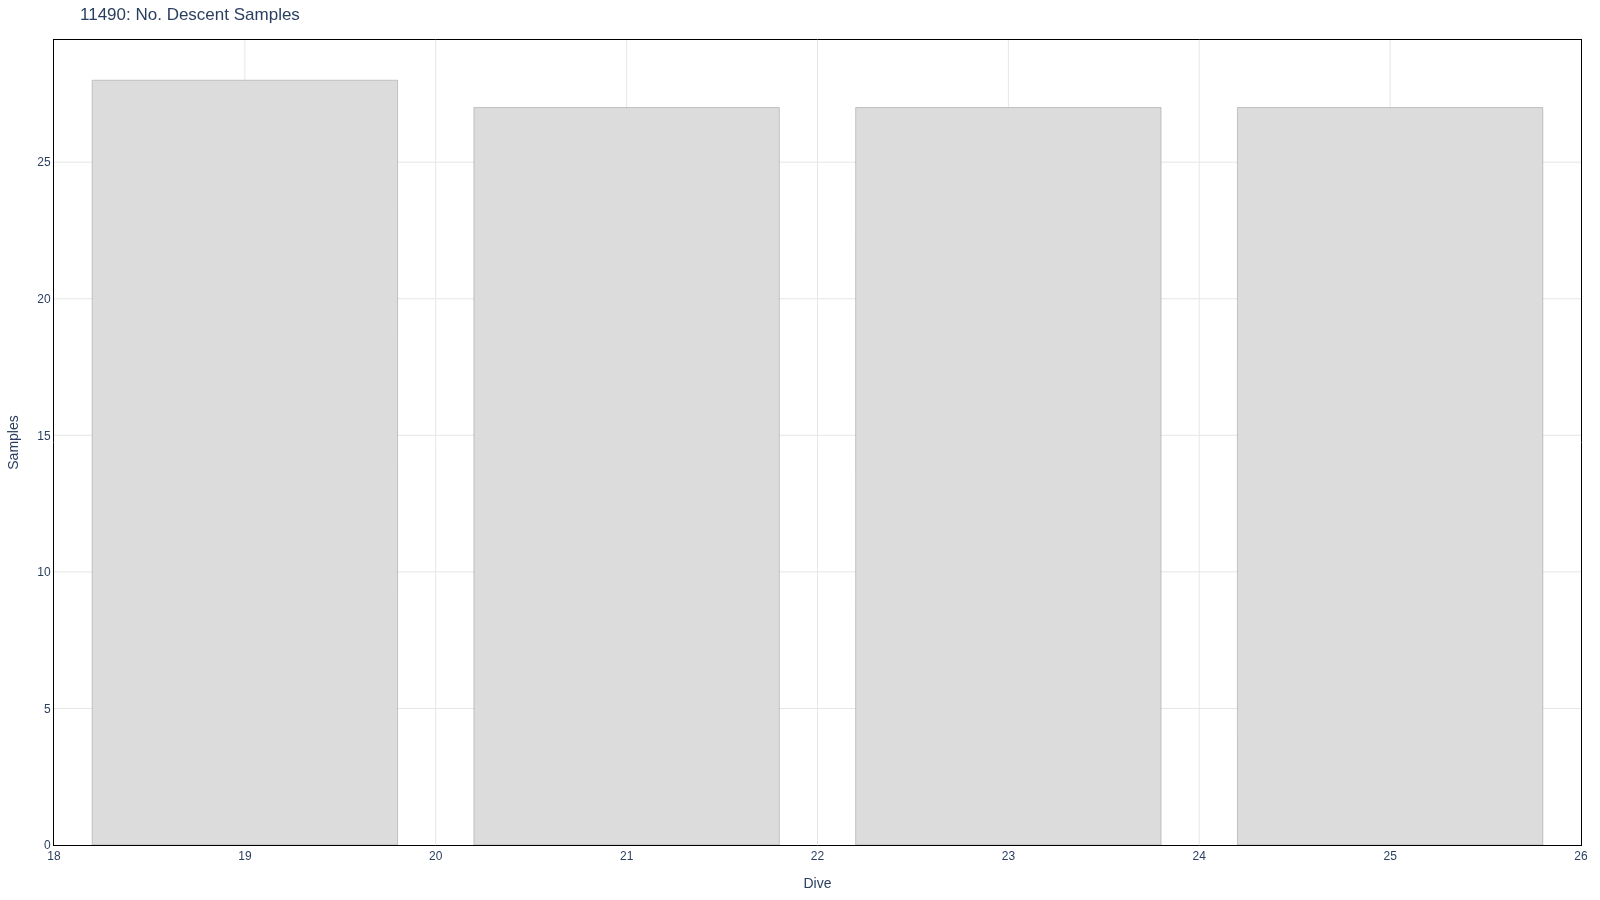
| 12 | No. Descent Samples | descent |  | descent_sample_count .html (8.4kB) .png [780x215] (15.6kB) .png [1600x900] (46.4kB) |
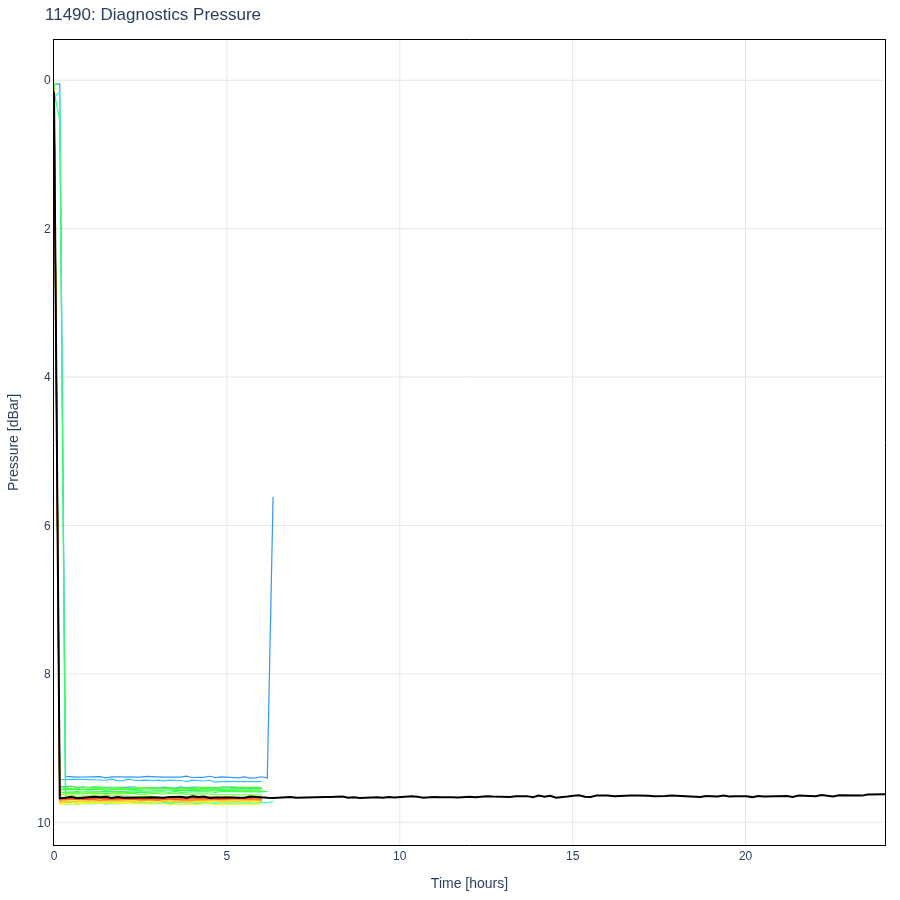
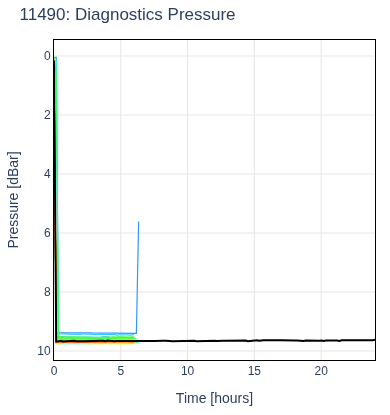
| 13 | Diagnostics Pressure | diagnostics | 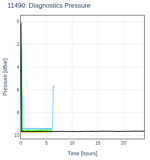 | diag_depth .html (70.9kB) .png [390x415] (24.9kB) .png [900x900] (65.0kB) |
| 14 | Humidity | diagnostics |  | diag_humid .html (83.0kB) .png [390x415] (33.8kB) .png [900x900] (101.6kB) |
| 15 | Average Humidity | diagnostics |  | diag_humid_avg .html (12.3kB) .png [390x415] (35.4kB) .png [900x900] (89.9kB) |
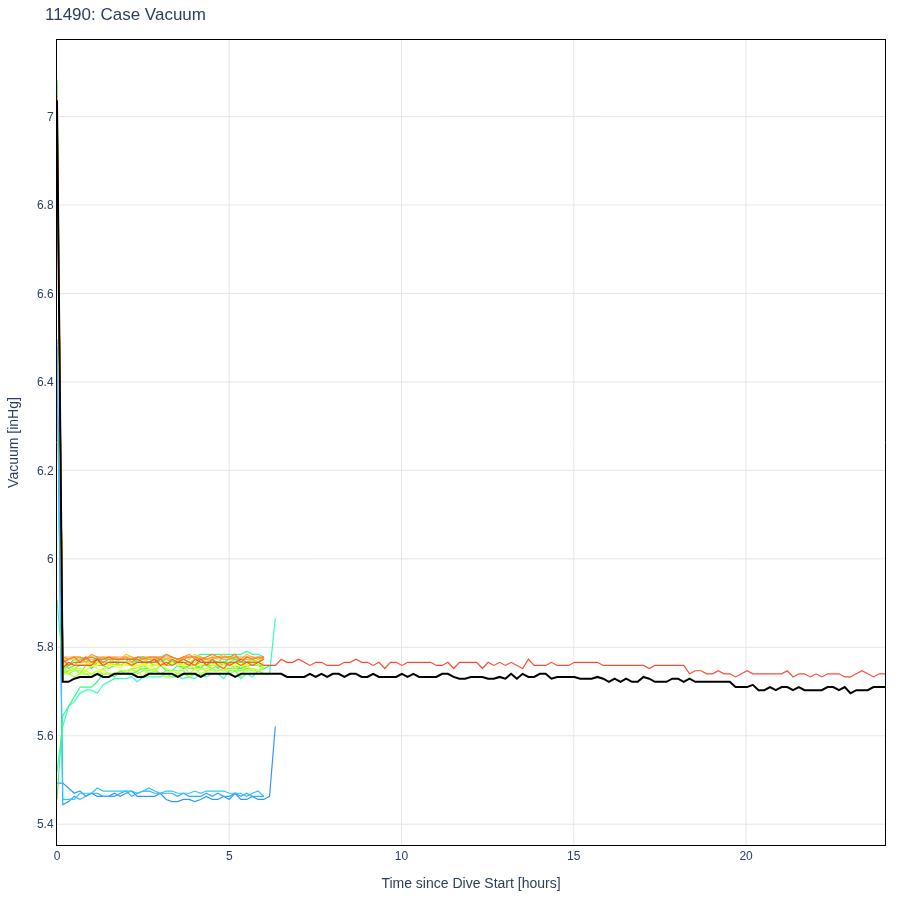
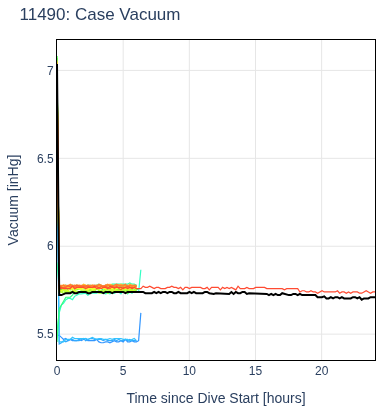
| 16 | Case Vacuum | diagnostics |  | diag_vac .html (83.7kB) .png [390x415] (25.6kB) .png [900x900] (69.8kB) |
| 17 | Average Case Vacuum | diagnostics |  | diag_vac_avg .html (12.3kB) .png [390x415] (30.5kB) .png [900x900] (77.4kB) |
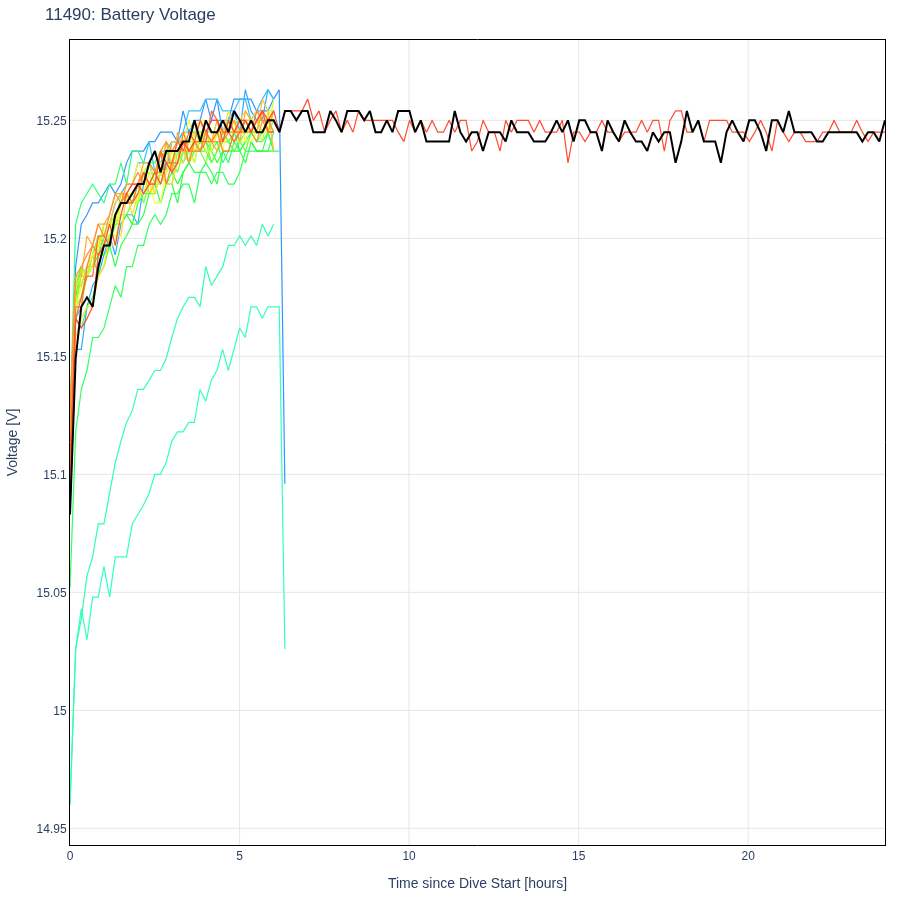
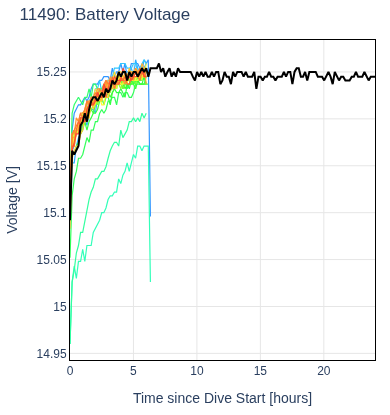
| 18 | Battery Voltage | diagnostics | 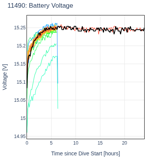 | diag_vbat .html (82.9kB) .png [390x415] (39.9kB) .png [900x900] (111.6kB) |
| 19 | Average Battery Voltage | diagnostics |  | diag_vbat_avg .html (12.4kB) .png [390x415] (38.9kB) .png [900x900] (92.5kB) |
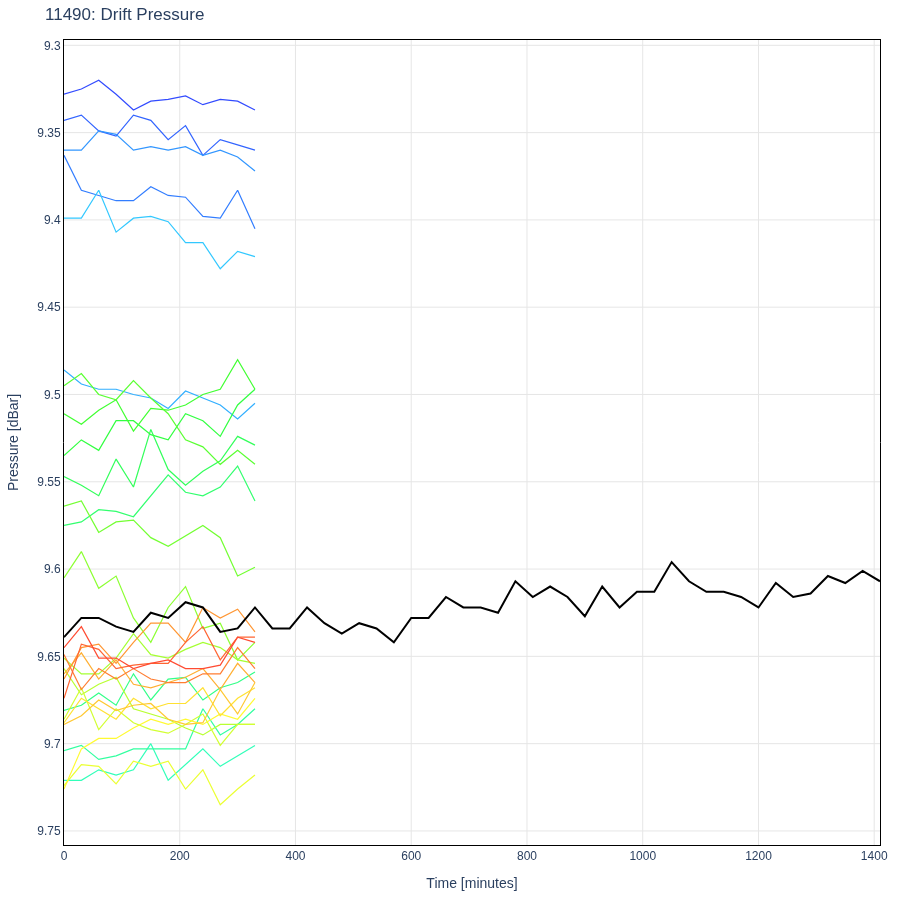
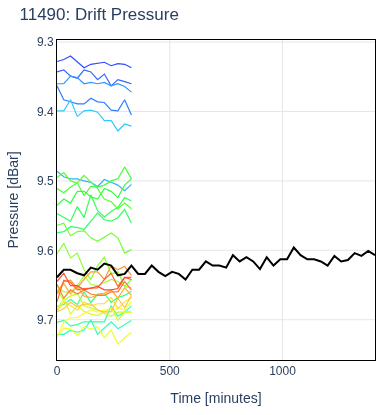
| 20 | Drift Pressure | drift | 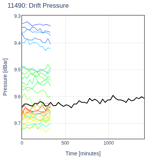 | drift_pres .html (58.8kB) .png [390x415] (42.2kB) .png [900x900] (117.5kB) |
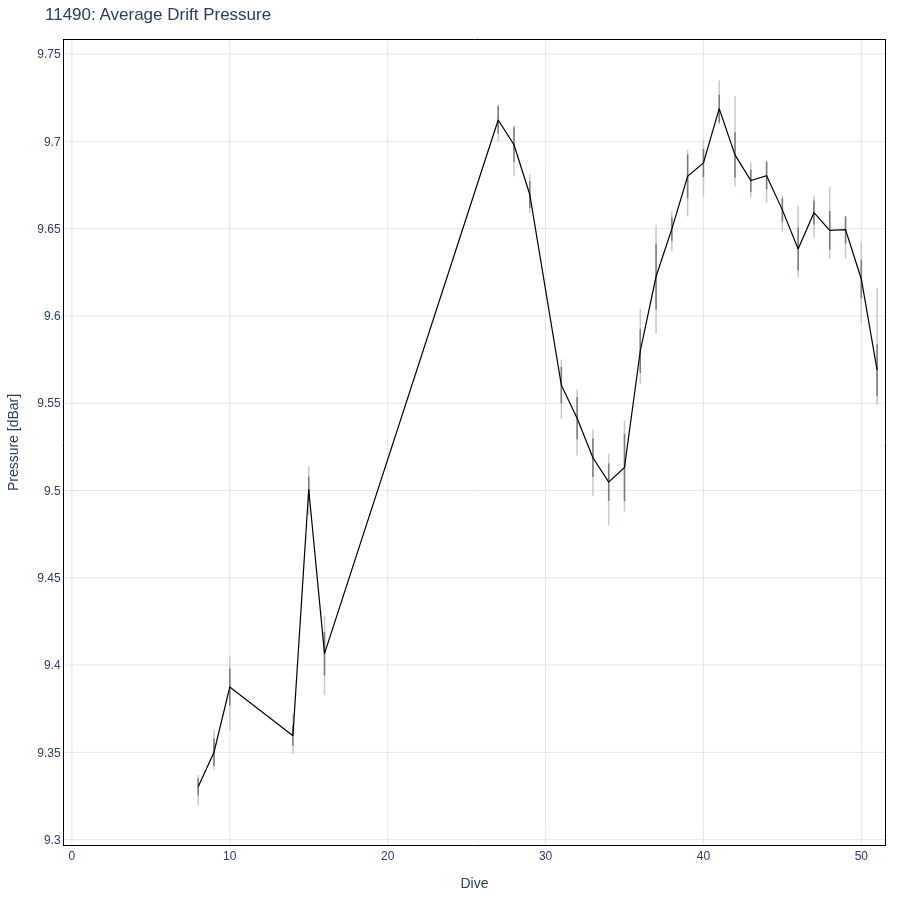
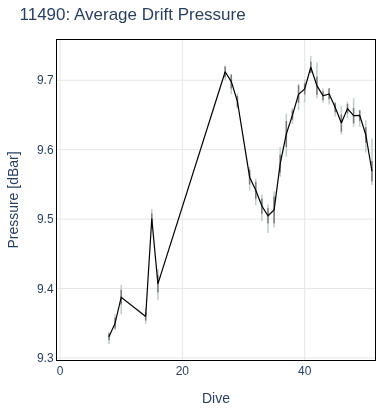
| 21 | Average Drift Pressure | drift | 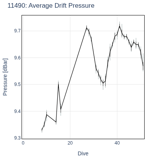 | drift_pres_avg .html (12.4kB) .png [390x415] (39.5kB) .png [900x900] (119.7kB) |
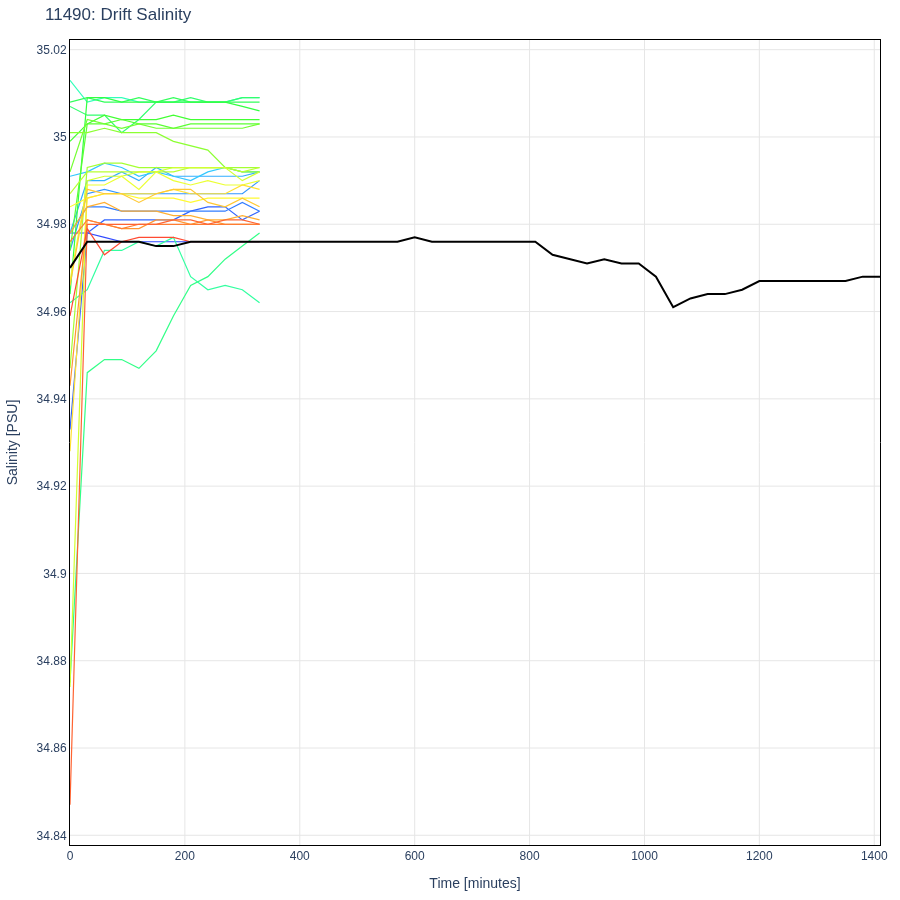
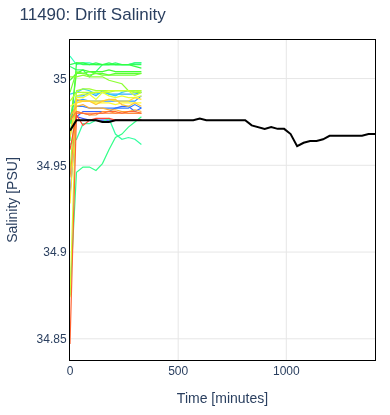
| 22 | Drift Salinity | drift | 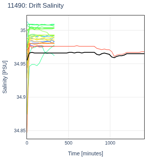 | drift_saln .html (58.9kB) .png [390x415] (30.2kB) .png [900x900] (87.3kB) |
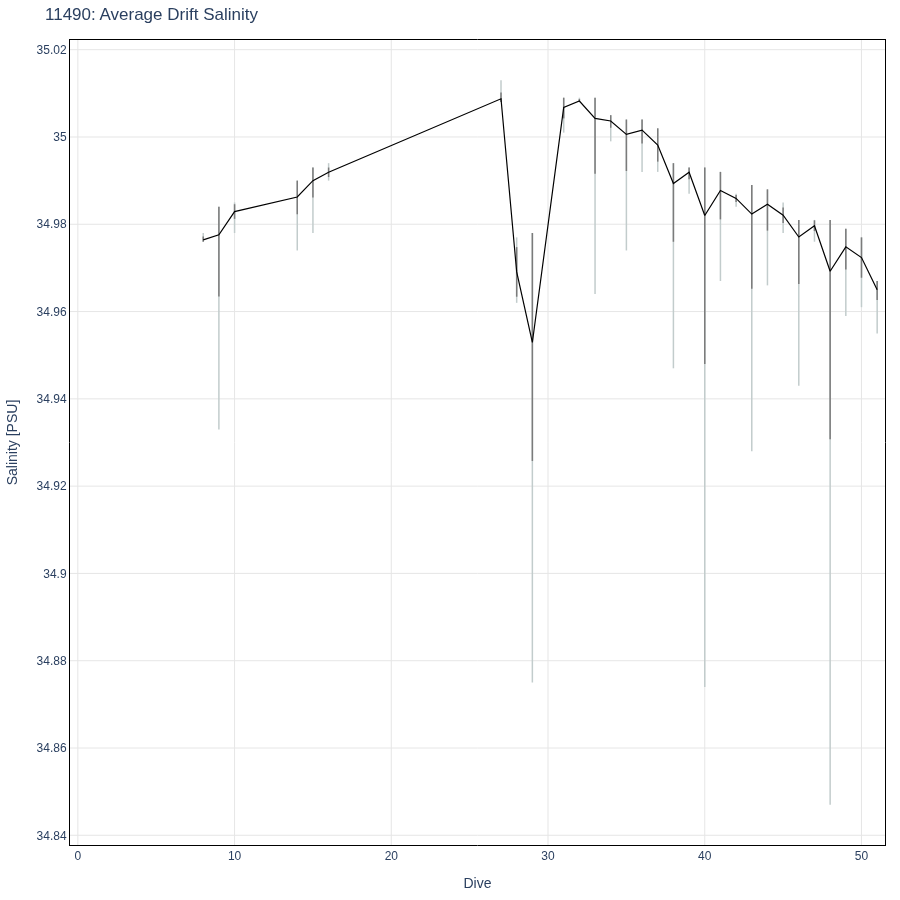
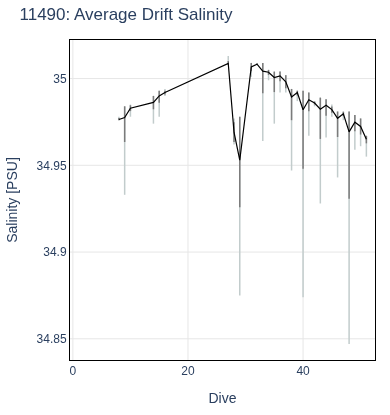
| 23 | Average Drift Salinity | drift |  | drift_saln_avg .html (12.5kB) .png [390x415] (42.1kB) .png [900x900] (120.9kB) |
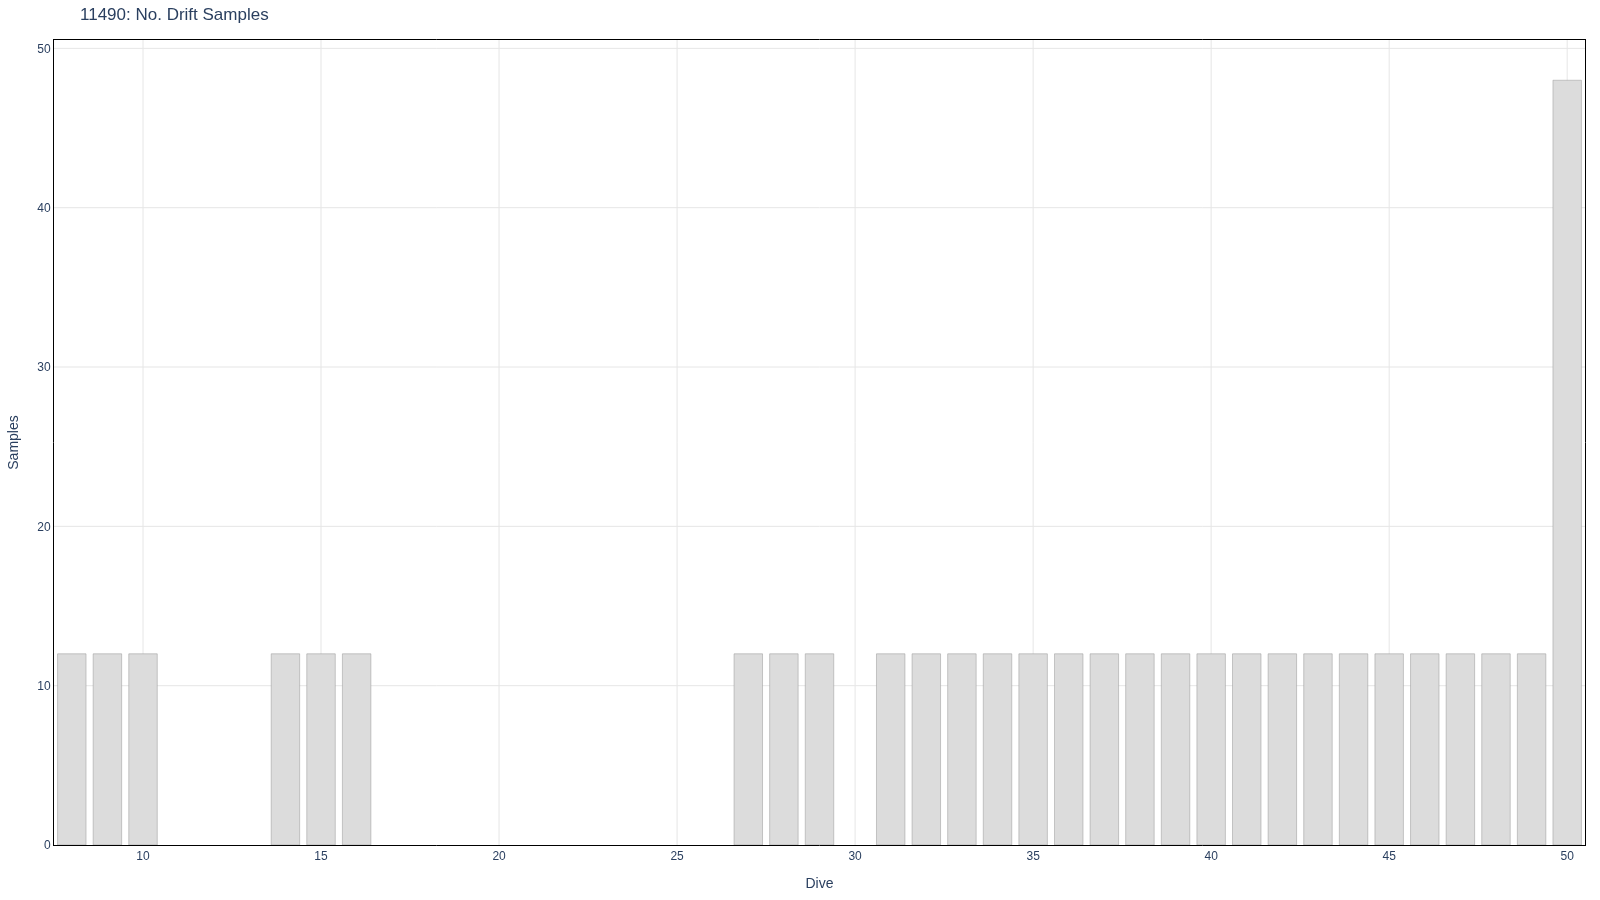
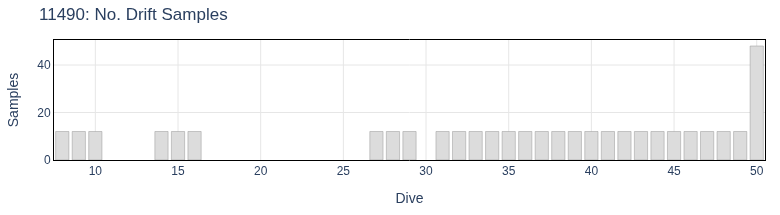
| 24 | No. Drift Samples | drift | 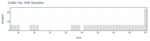 | drift_sample_count .html (8.5kB) .png [780x215] (16.8kB) .png [1600x900] (48.5kB) |
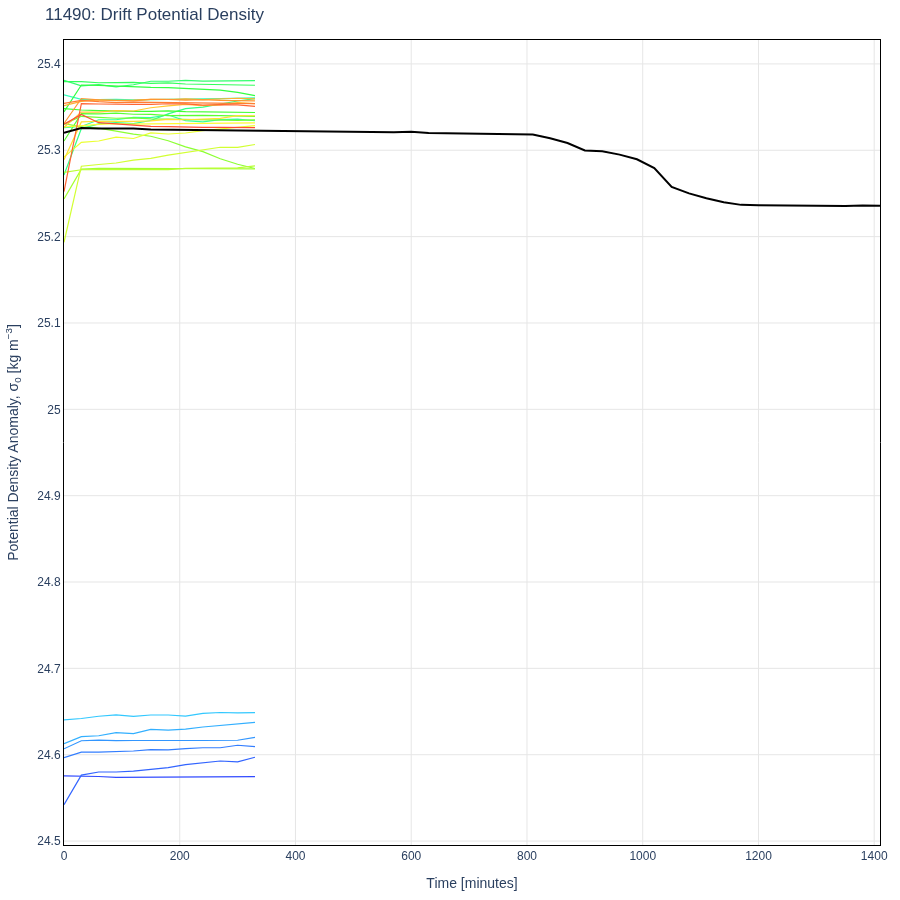
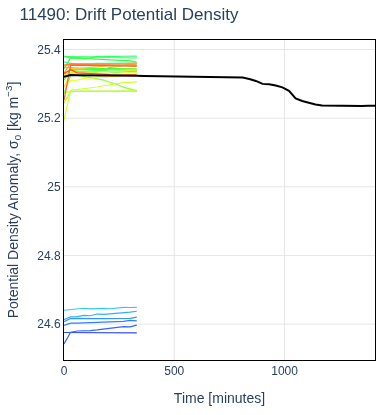
| 25 | Drift Potential Density | drift | 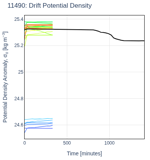 | drift_sigma0 .html (58.9kB) .png [390x415] (33.5kB) .png [900x900] (85.7kB) |
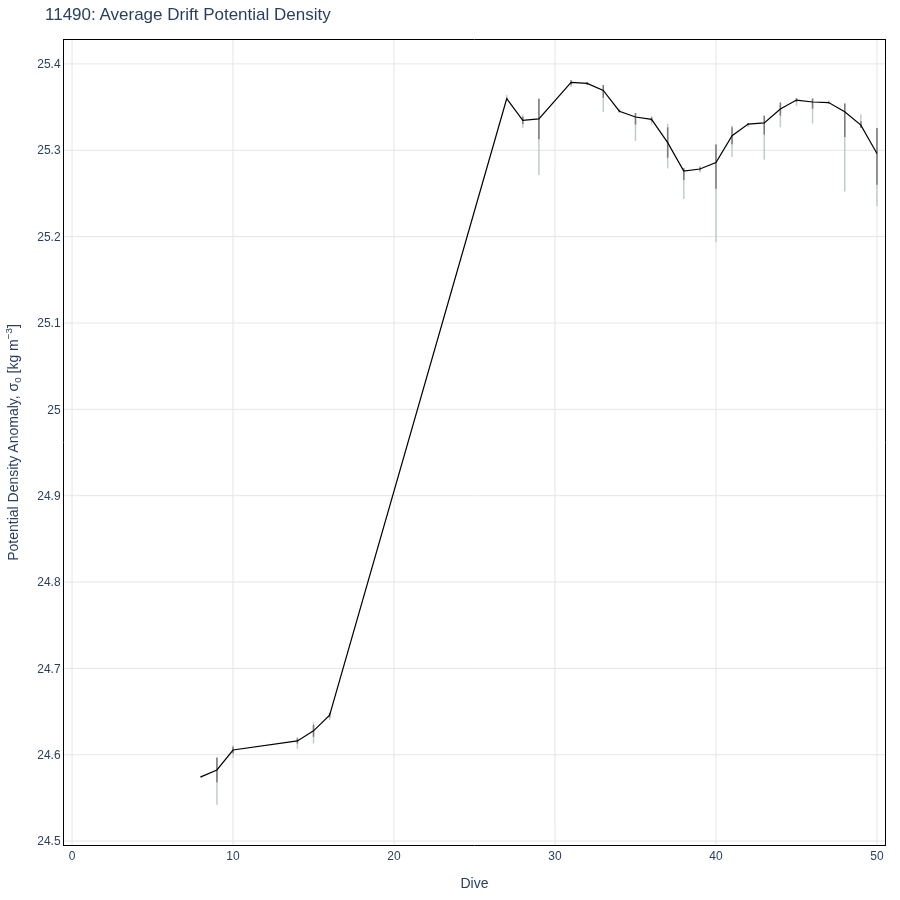
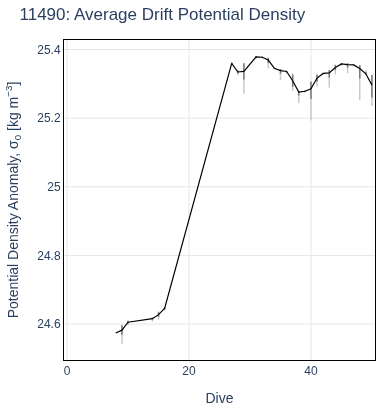
| 26 | Average Drift Potential Density | drift | 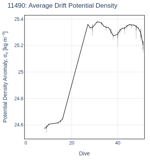 | drift_sigma0_avg .html (13.4kB) .png [390x415] (34.3kB) .png [900x900] (88.3kB) |
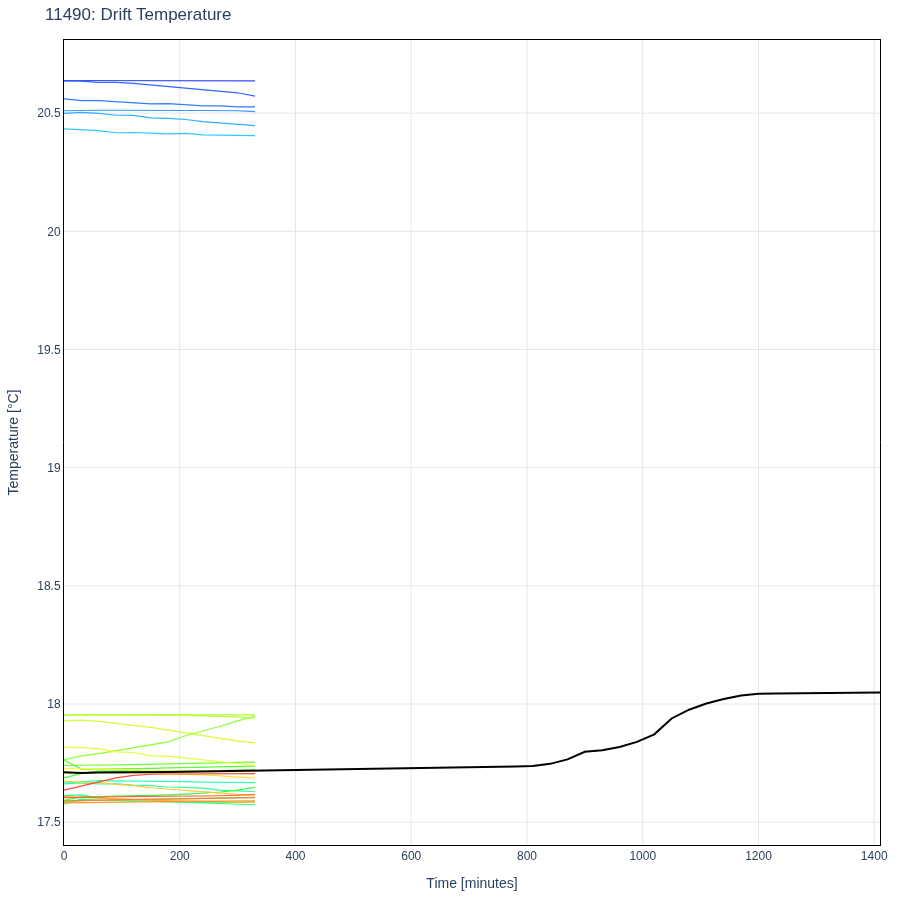
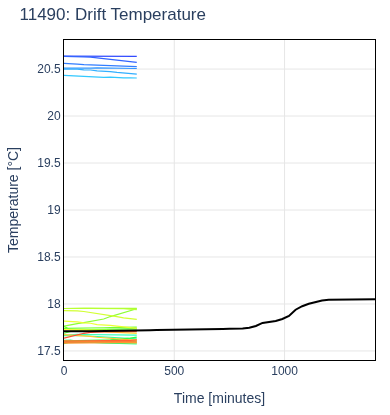
| 27 | Drift Temperature | drift | 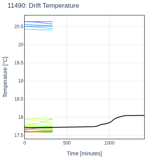 | drift_temp .html (58.9kB) .png [390x415] (29.9kB) .png [900x900] (75.8kB) |
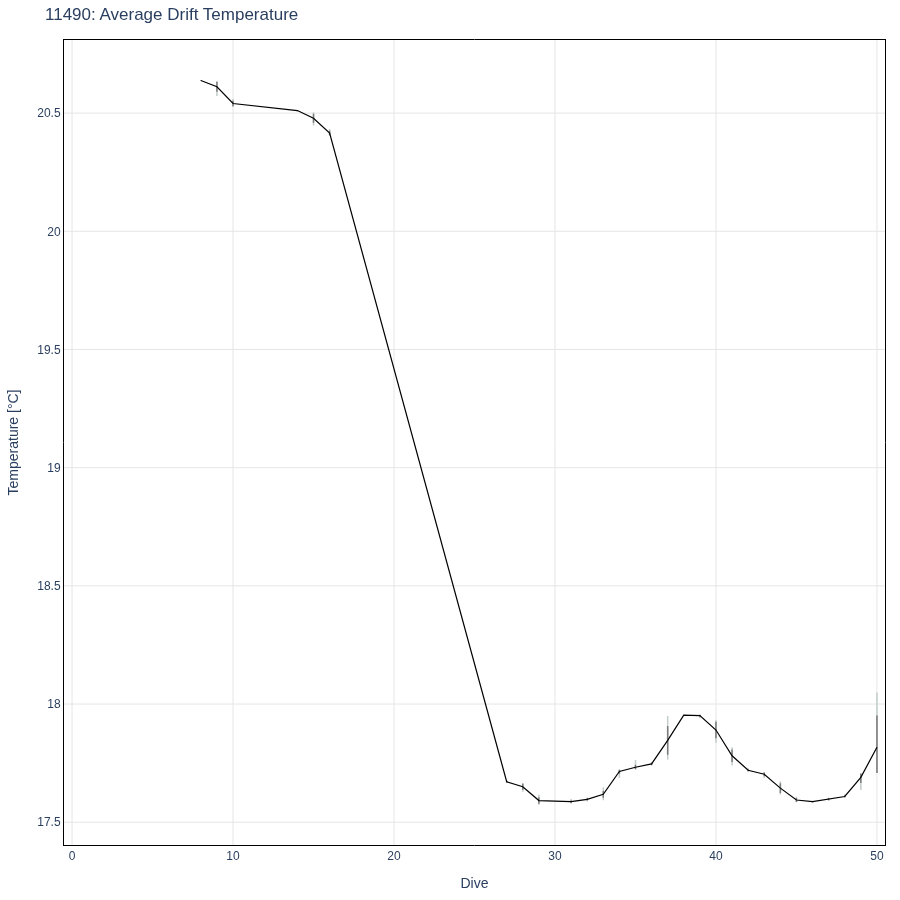
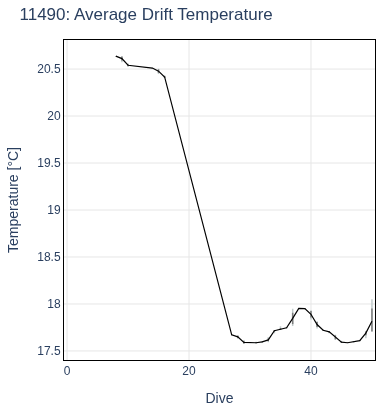
| 28 | Average Drift Temperature | drift | 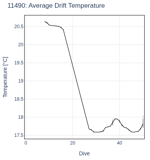 | drift_temp_avg .html (12.5kB) .png [390x415] (28.6kB) .png [900x900] (72.3kB) |
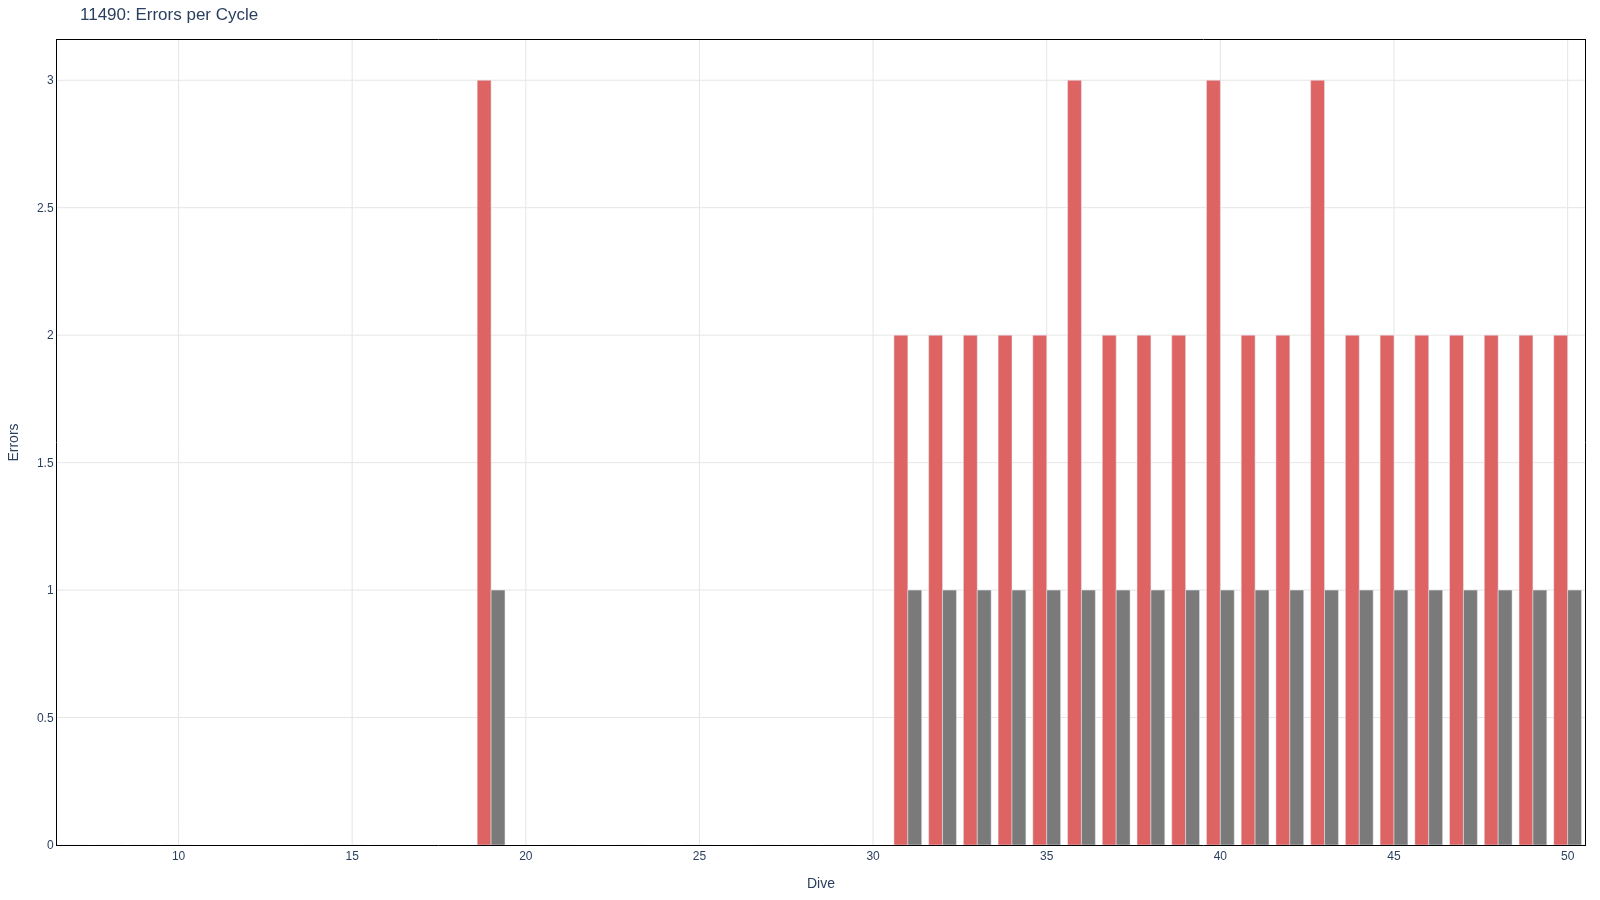
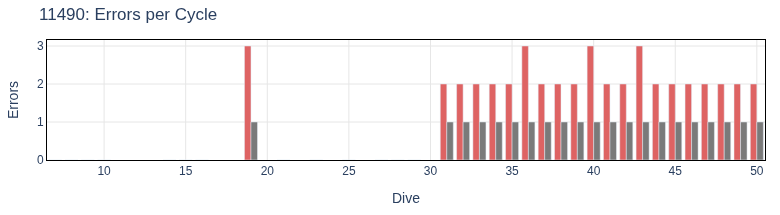
| 29 | Errors per Cycle | diagnostics | 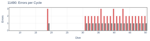 | engine_errors .html (9.5kB) .png [780x215] (17.4kB) .png [1600x900] (49.9kB) |
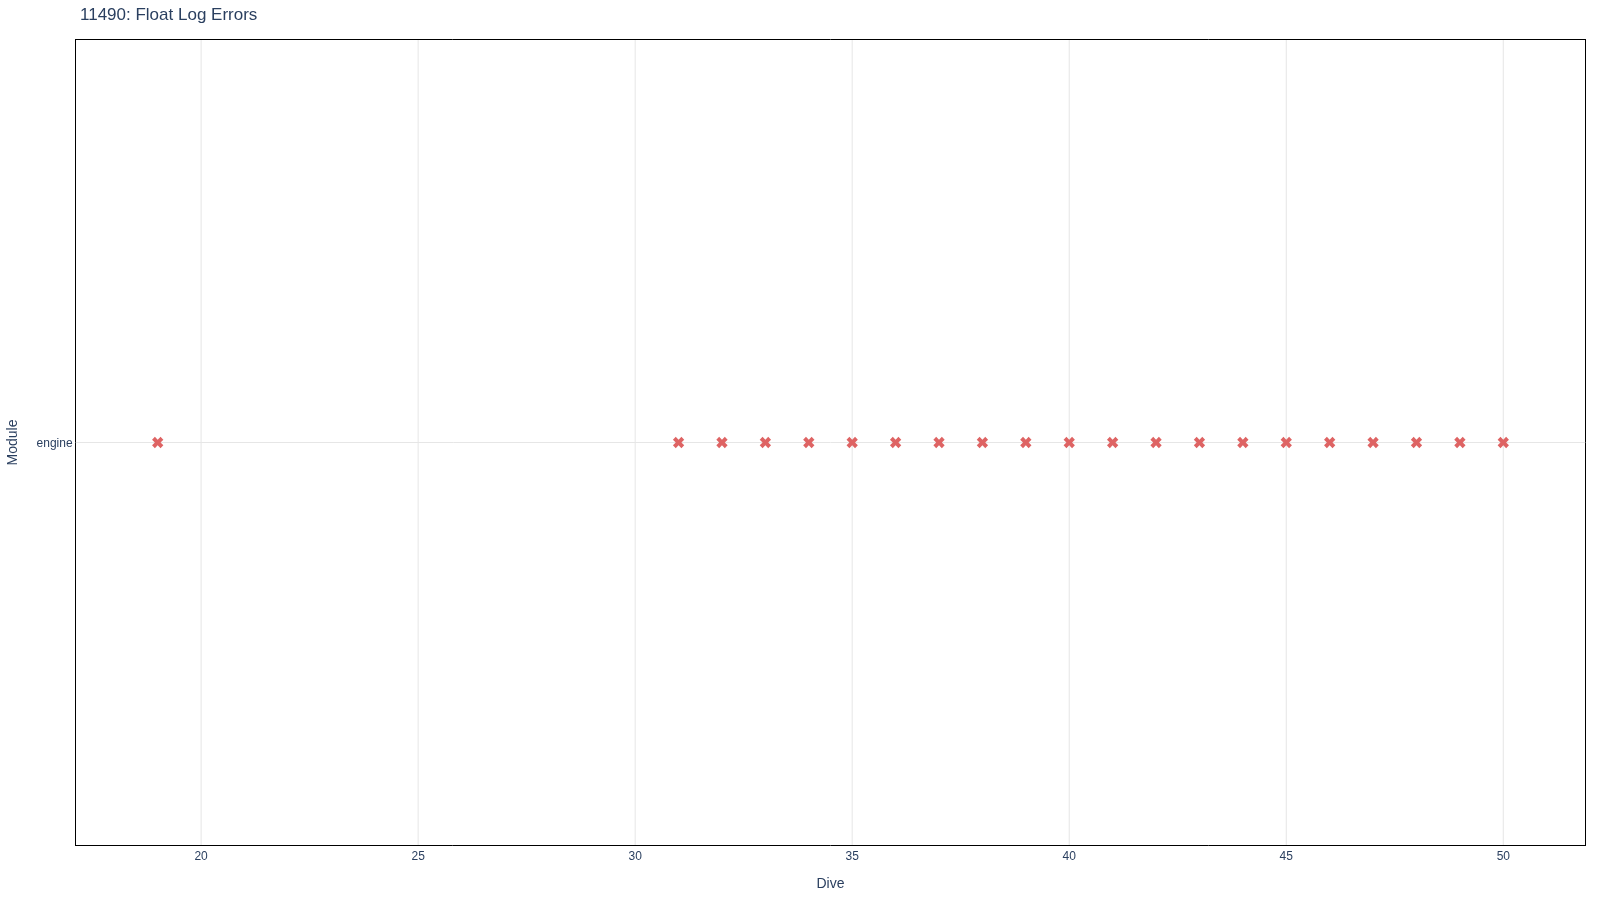
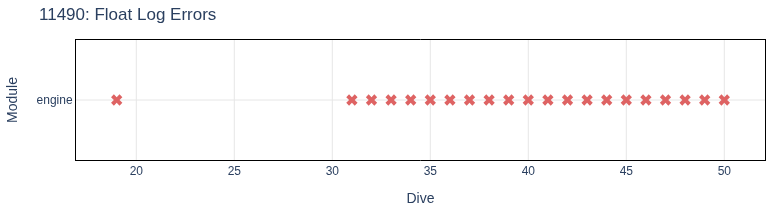
| 30 | Float Log Errors | mission |  | float_errors .html (10.0kB) .png [780x215] (14.2kB) .png [1600x900] (47.9kB) |
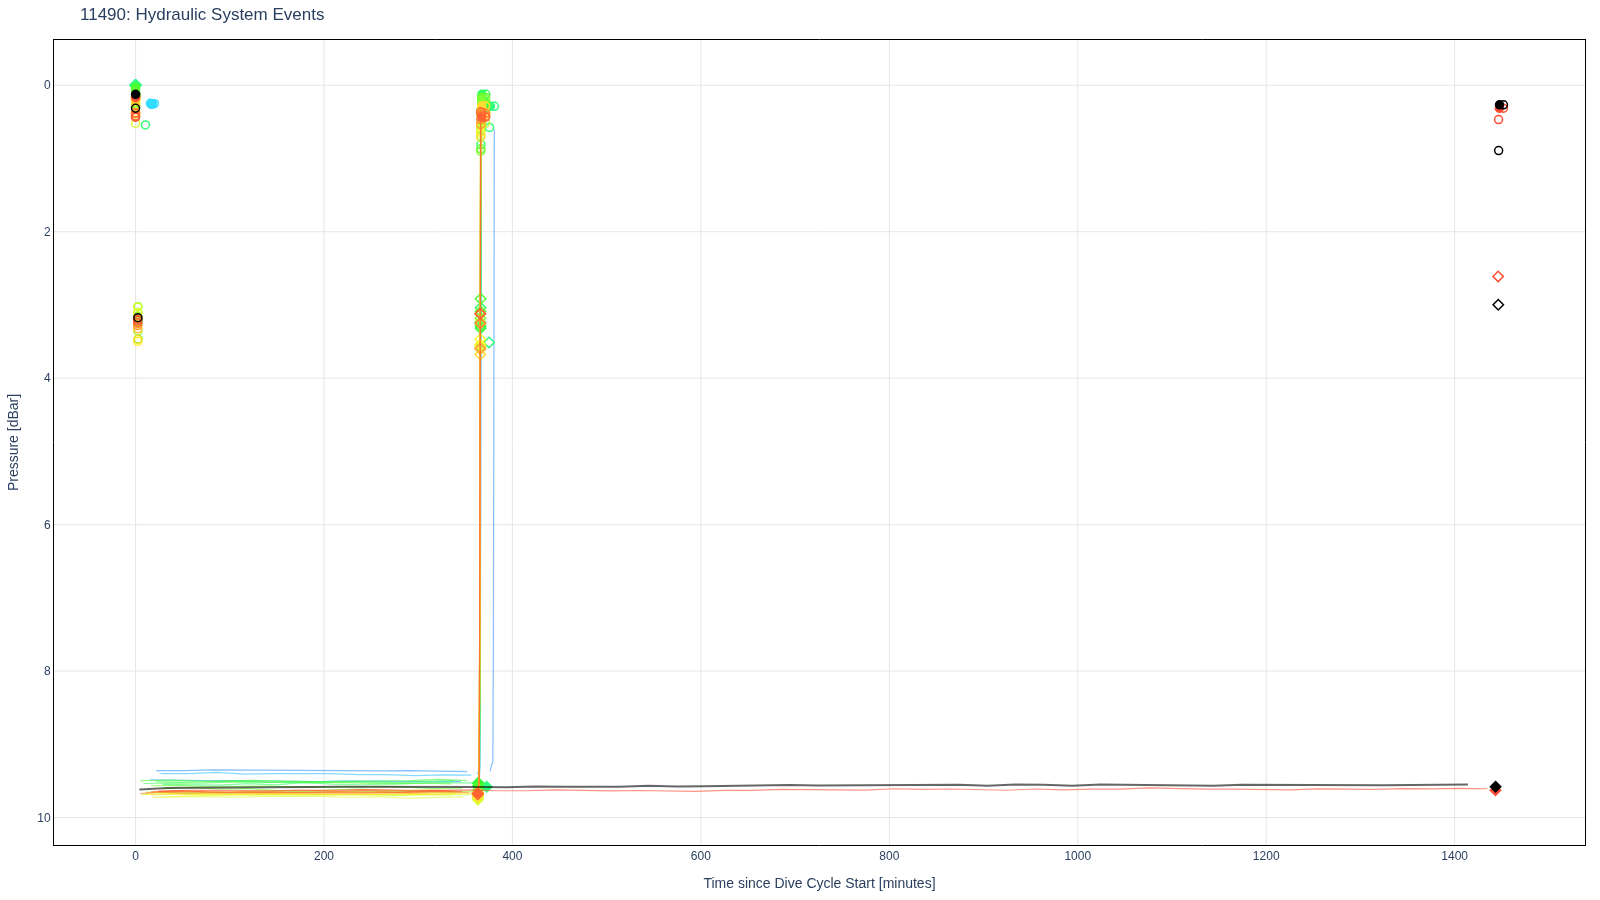
| 31 | Hydraulic System Events | hydraulic |  | hydraulic_events .html (91.0kB) .png [780x415] (41.6kB) .png [1600x900] (100.3kB) |
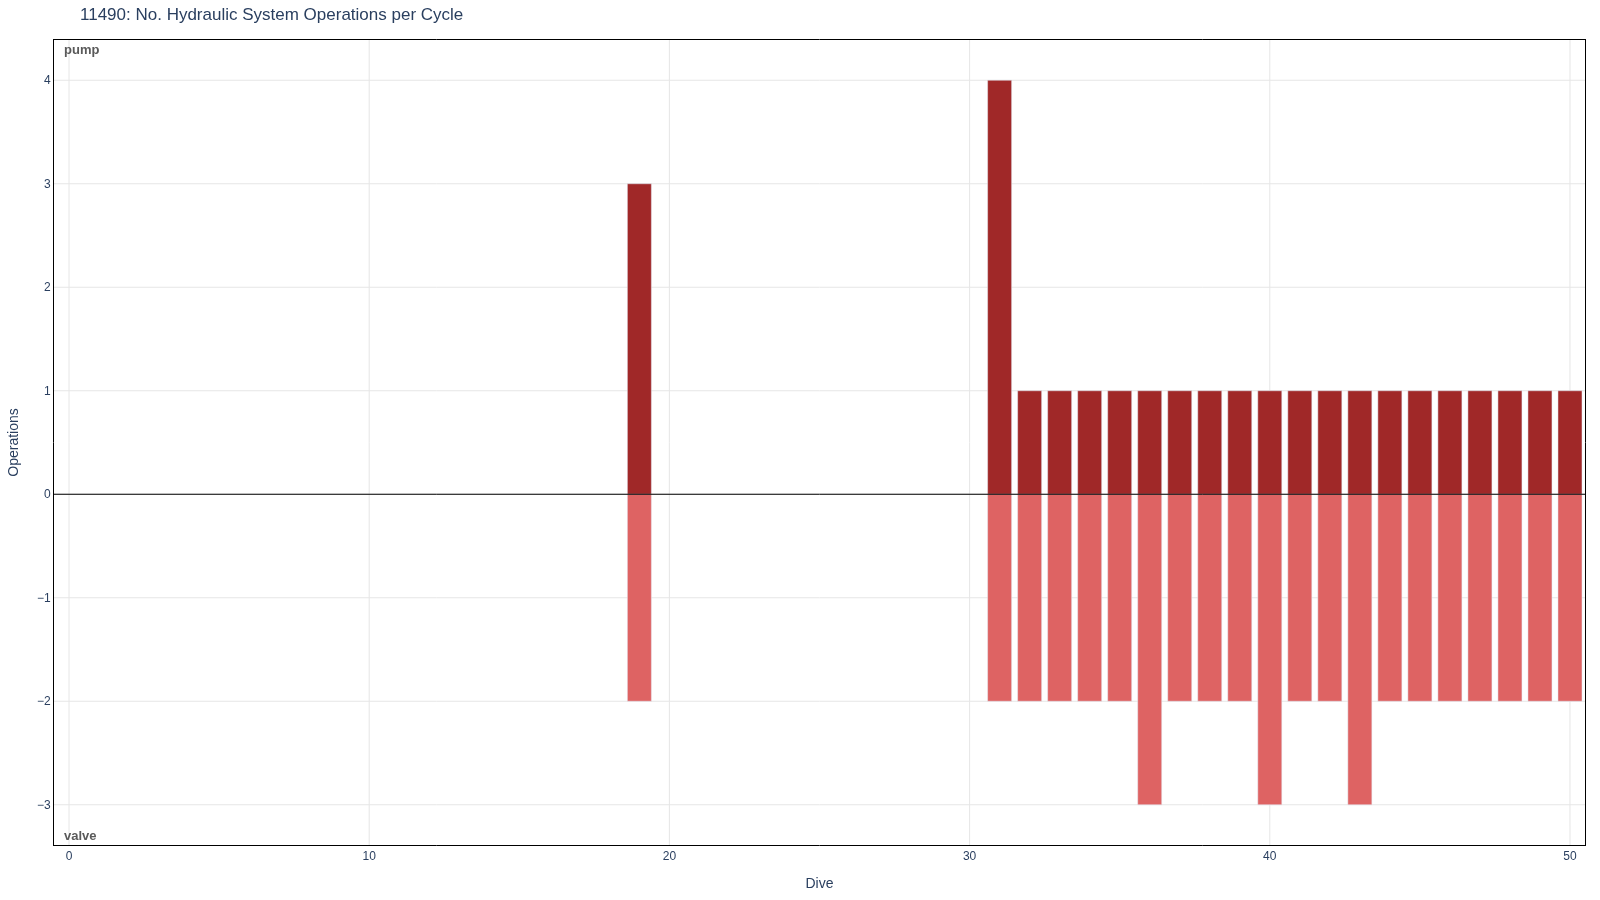
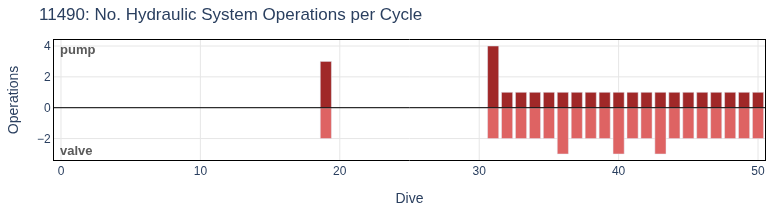
| 32 | No. Hydraulic System Operations per Cycle | hydraulic | 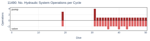 | hydraulic_num_ops .html (8.9kB) .png [780x215] (21.0kB) .png [1600x900] (53.3kB) |
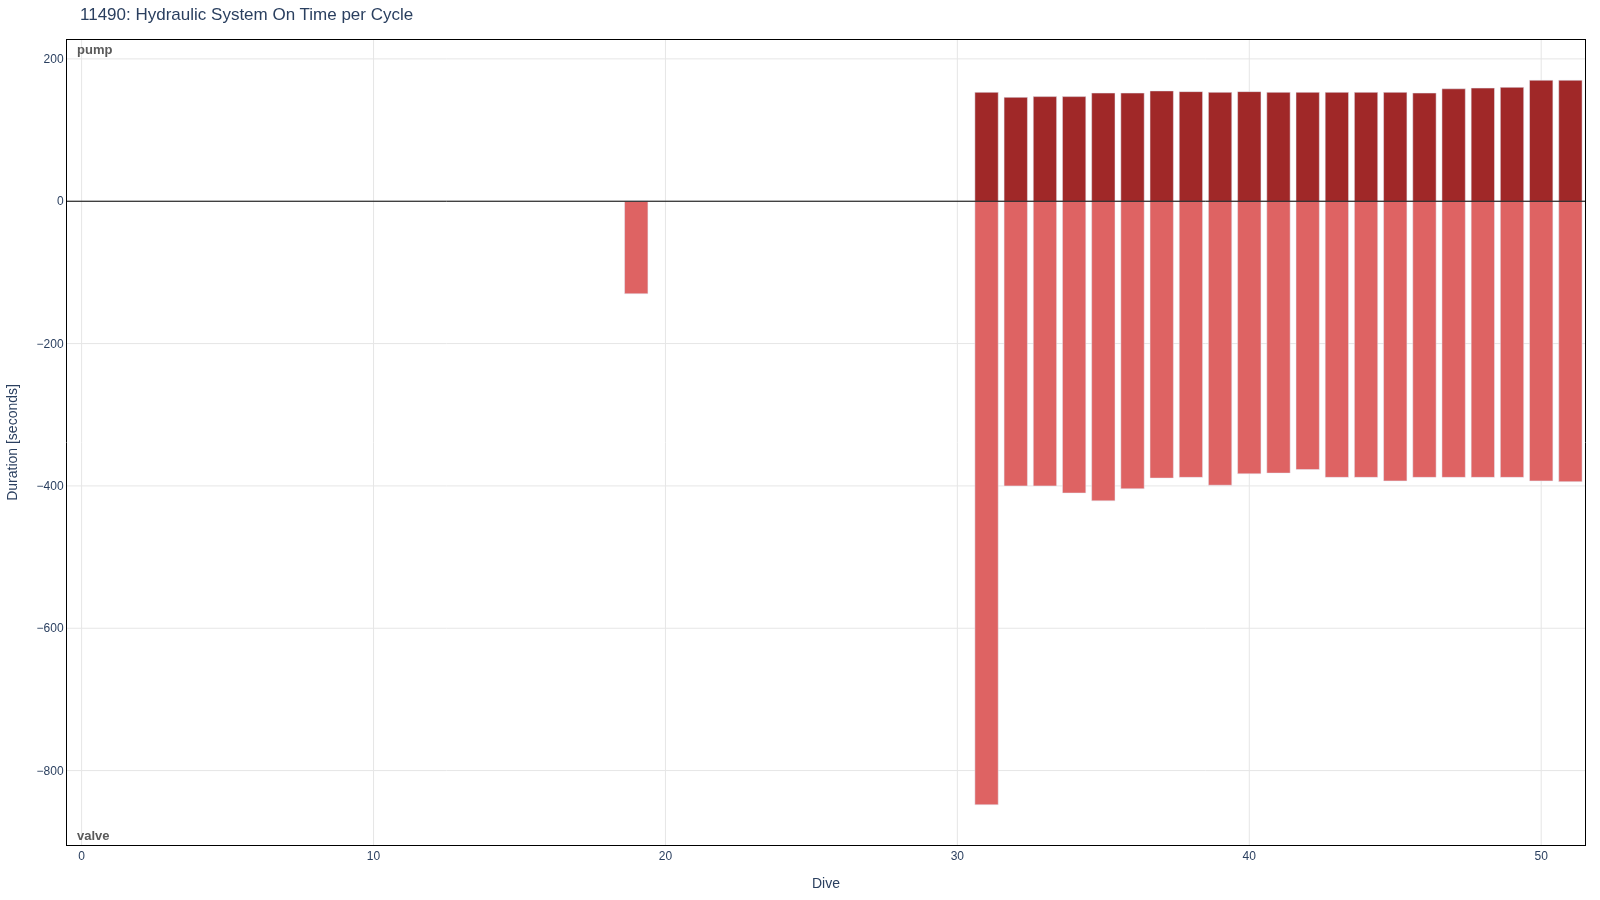
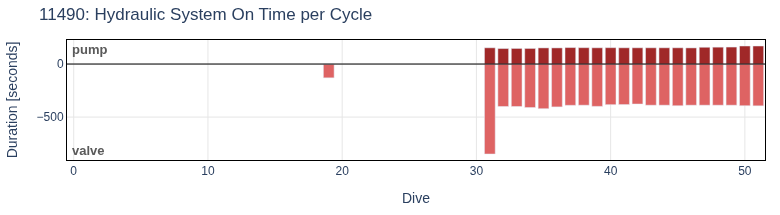
| 33 | Hydraulic System On Time per Cycle | hydraulic |  | hydraulic_on_time .html (9.6kB) .png [780x215] (21.8kB) .png [1600x900] (57.4kB) |
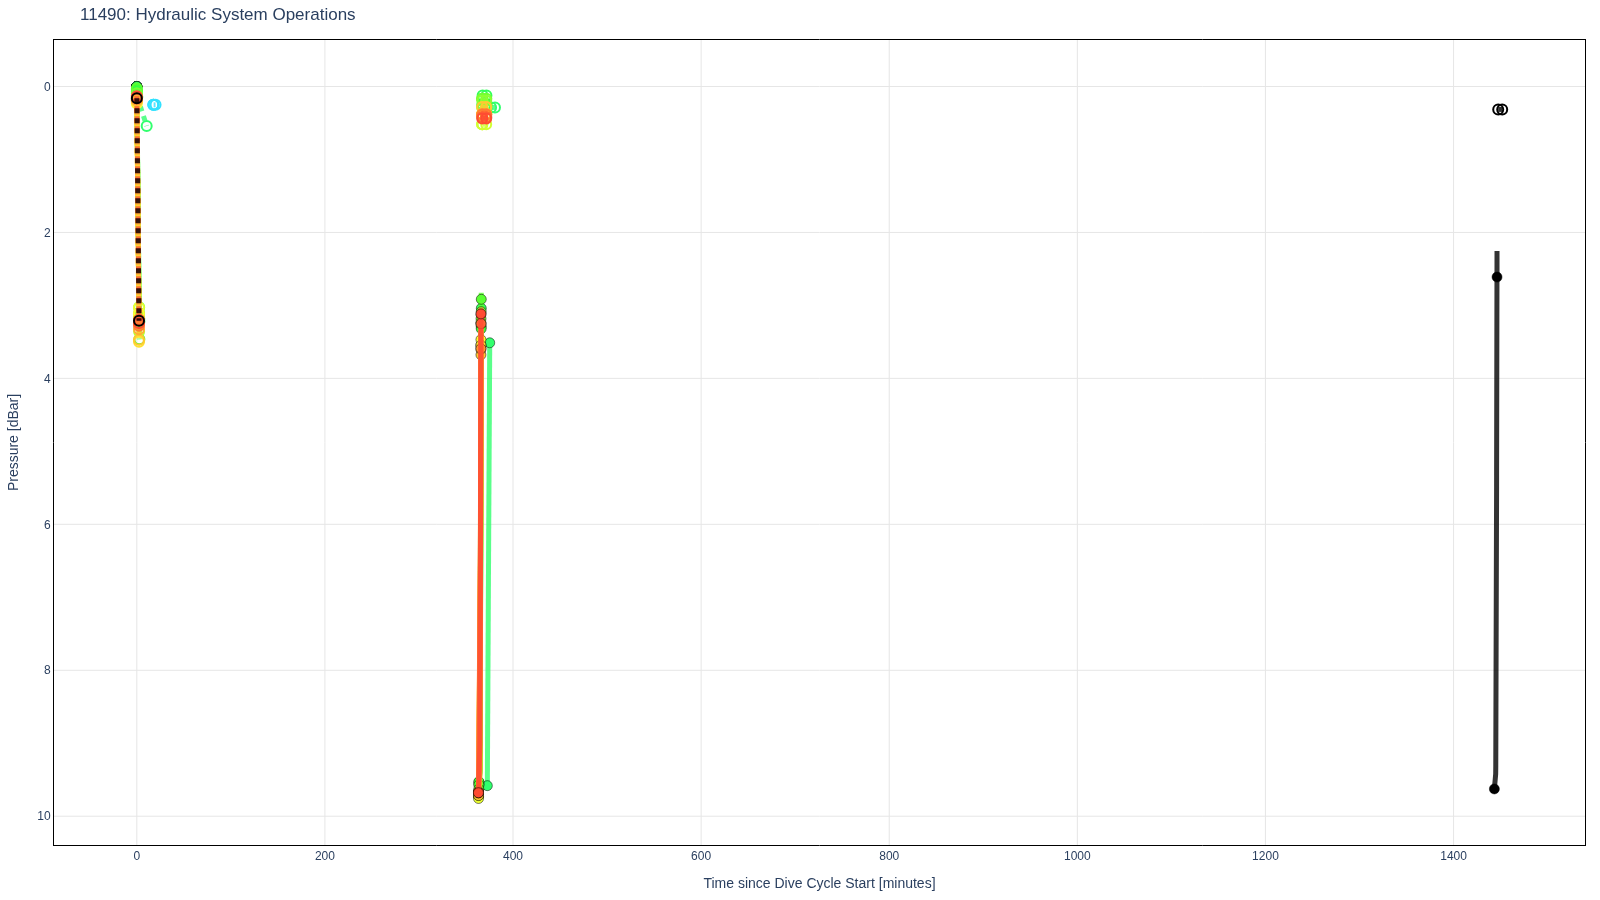
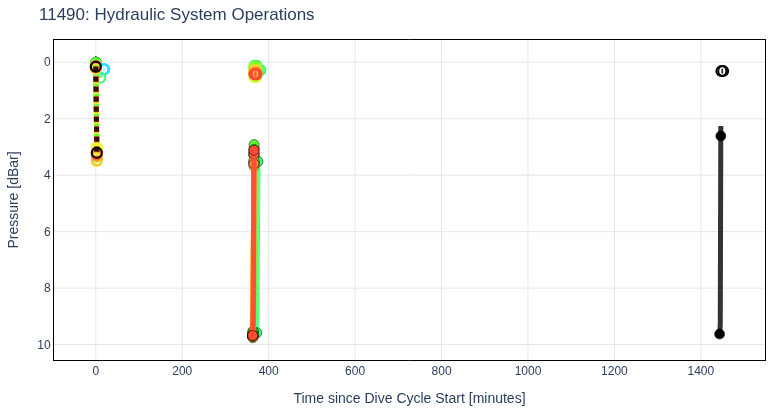
| 34 | Hydraulic System Operations | hydraulic | 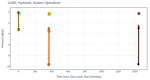 | hydraulic_operations .html (108.9kB) .png [780x415] (36.2kB) .png [1600x900] (74.2kB) |
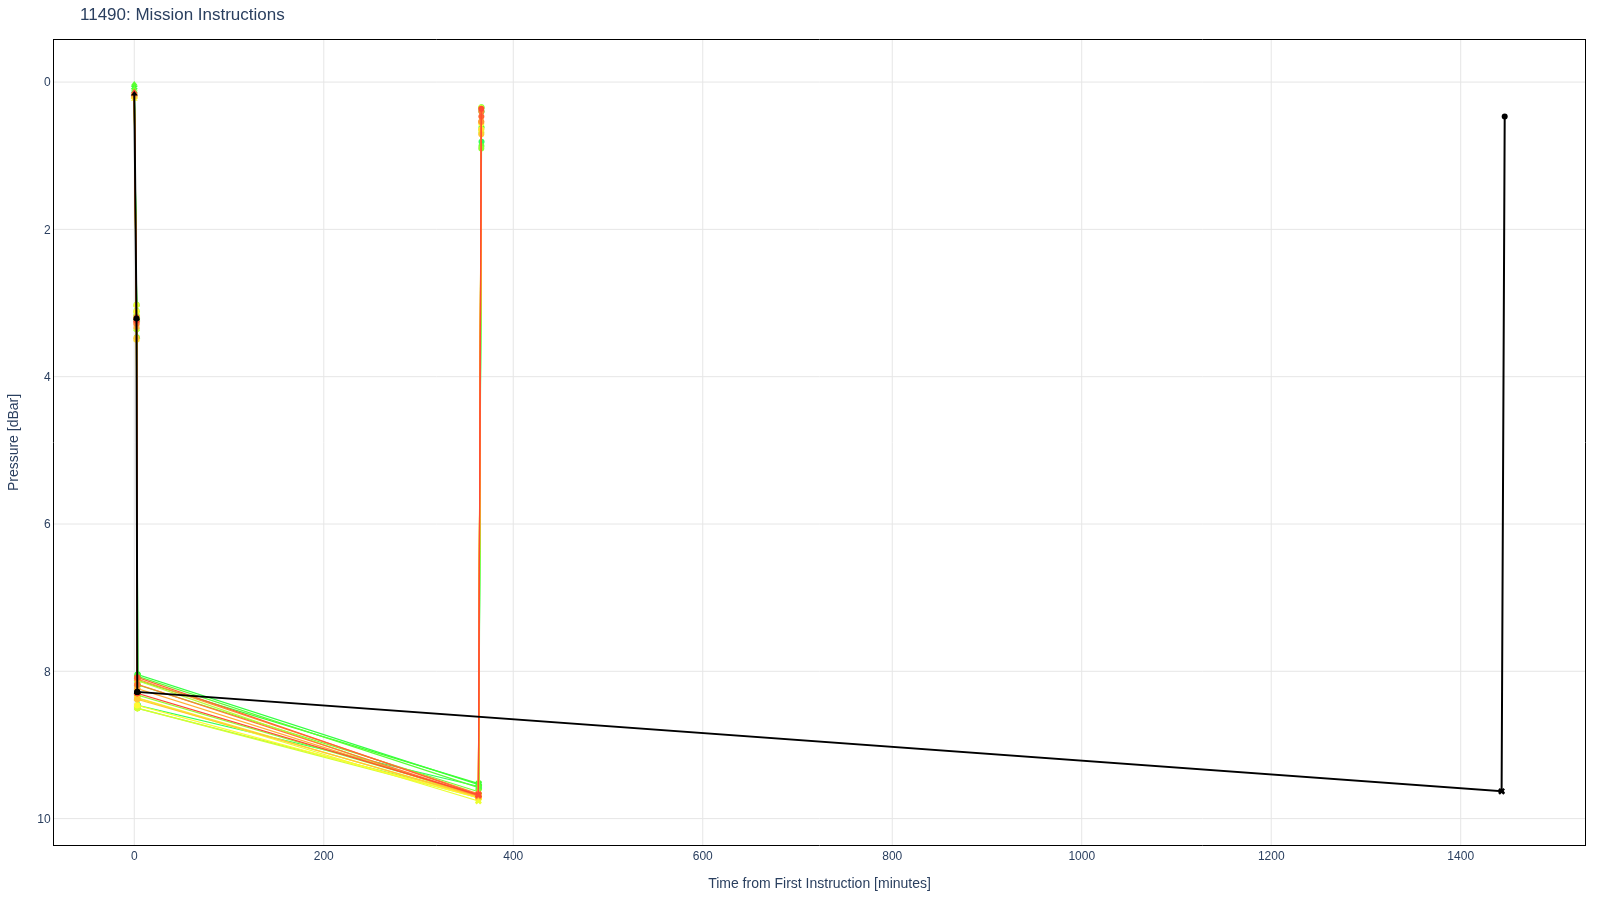
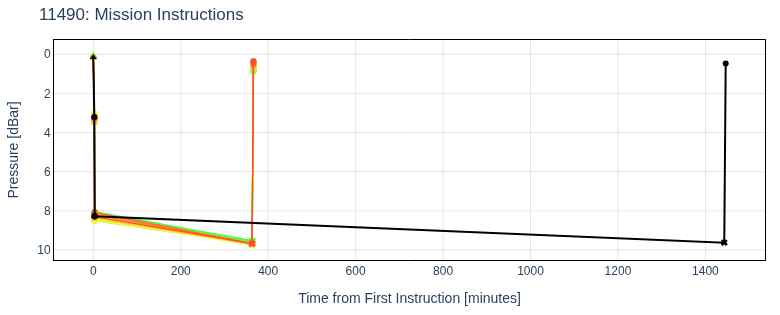
| 35 | Mission Instructions | mission | 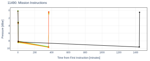 | instructions .html (34.8kB) .png [780x315] (35.9kB) .png [1600x900] (111.9kB) |
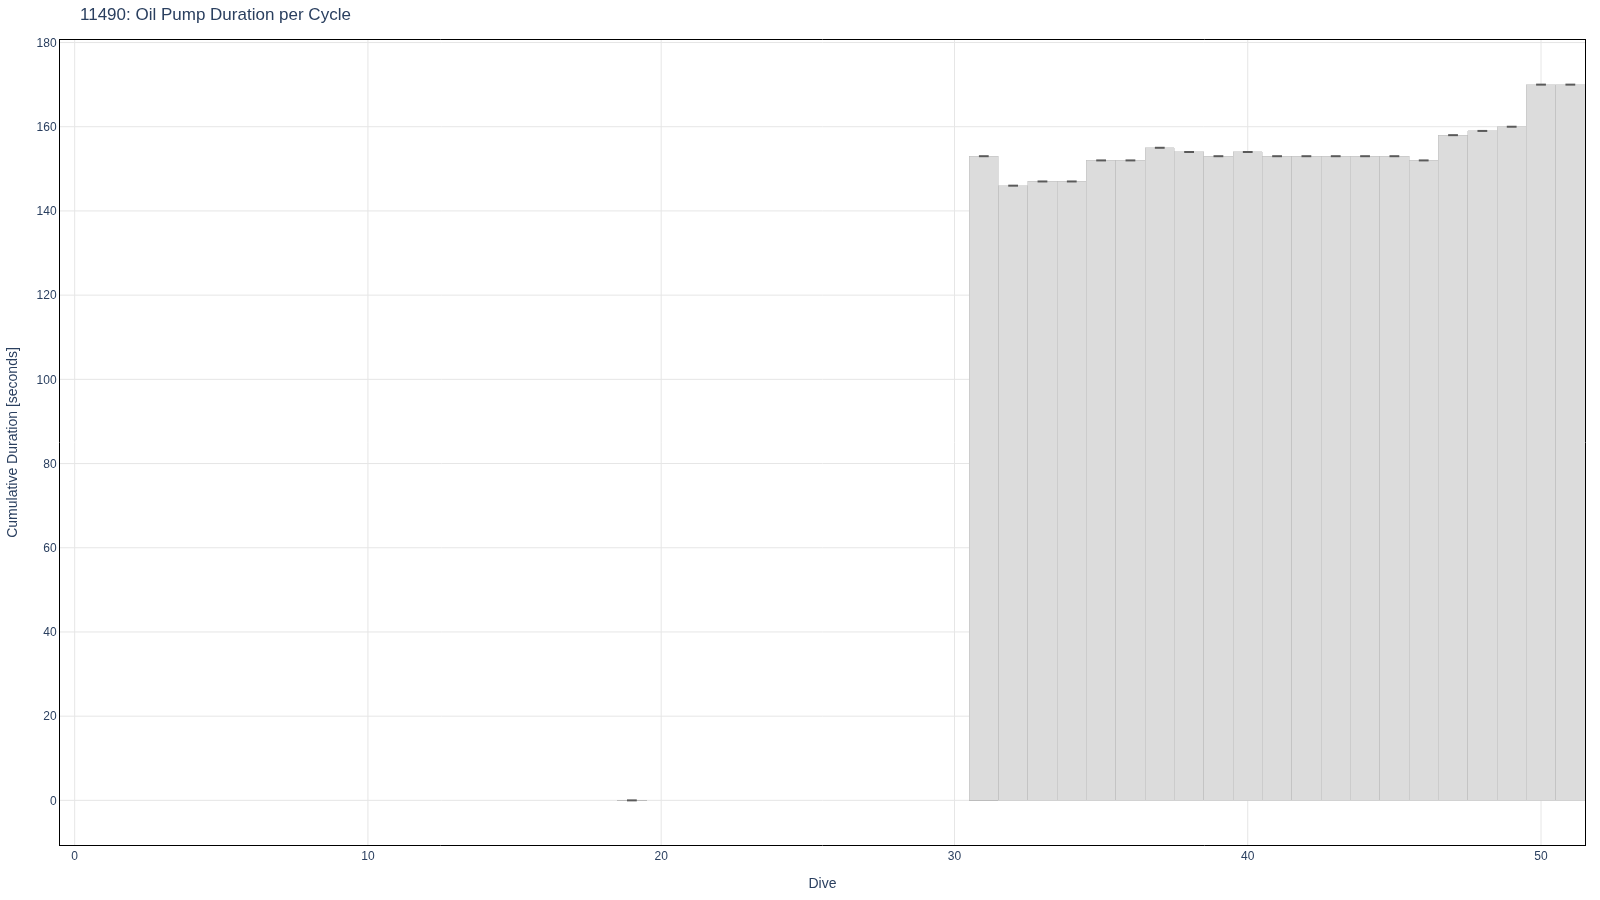
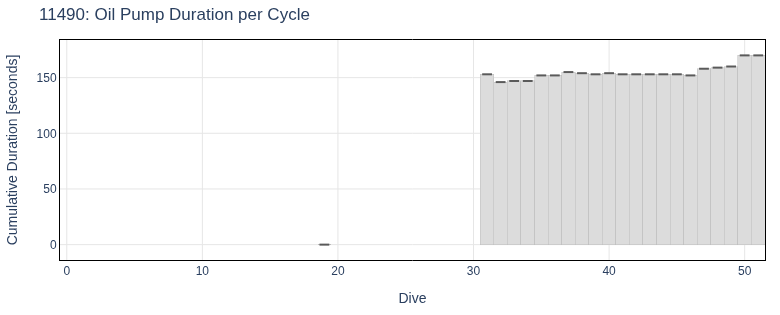
| 36 | Oil Pump Duration per Cycle | hydraulic | 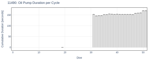 | oil_pump_duration .html (11.2kB) .png [780x315] (21.8kB) .png [1600x900] (55.6kB) |
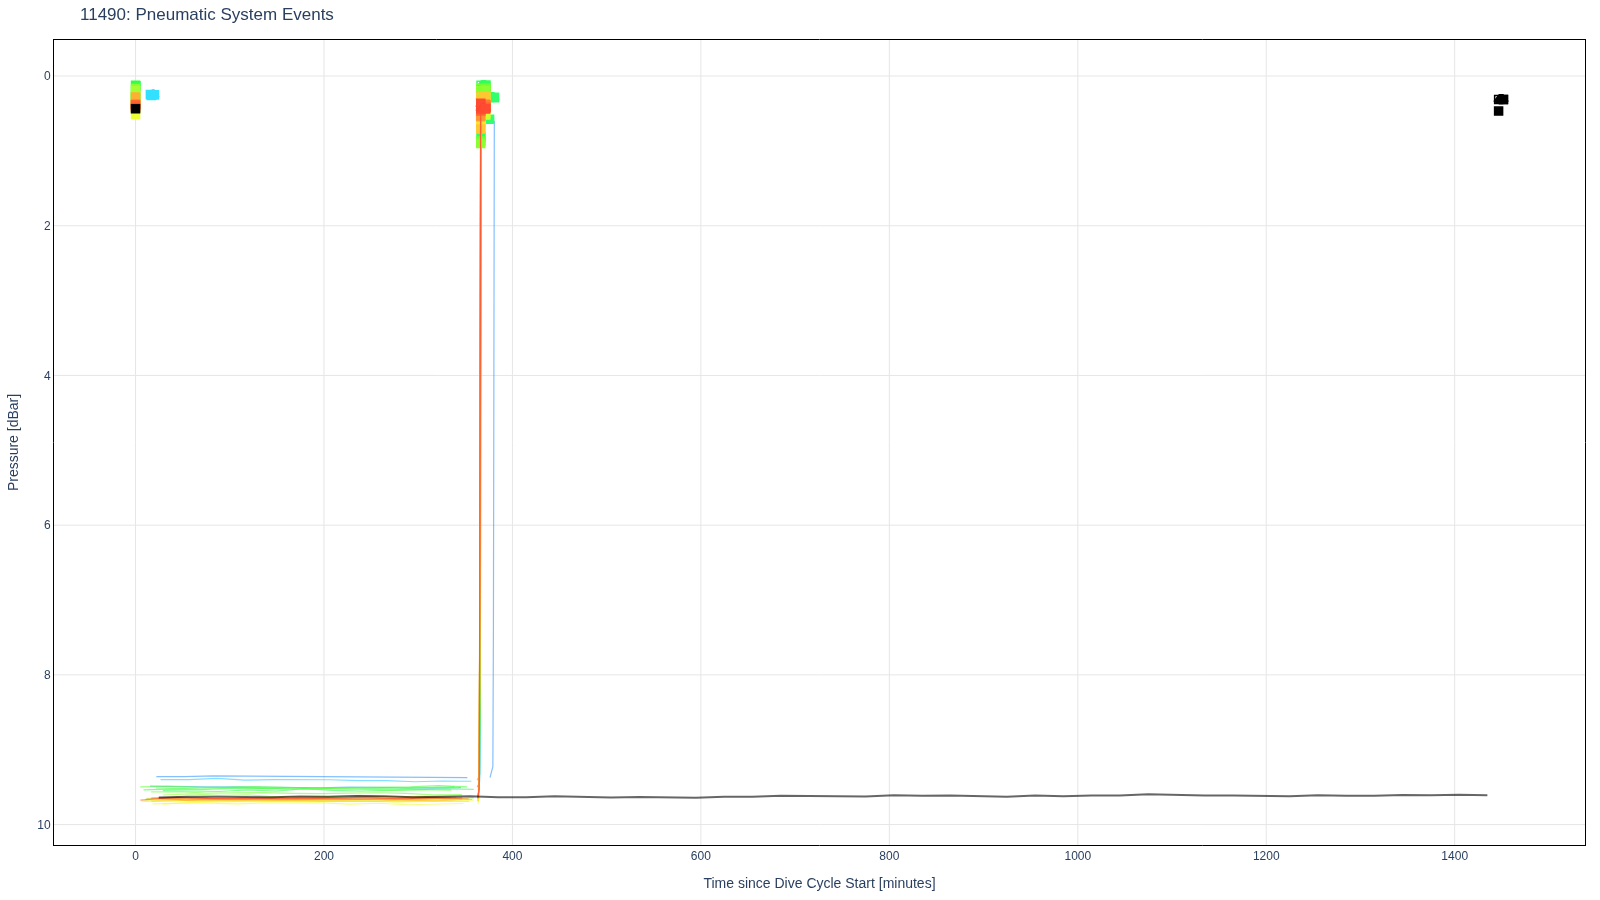
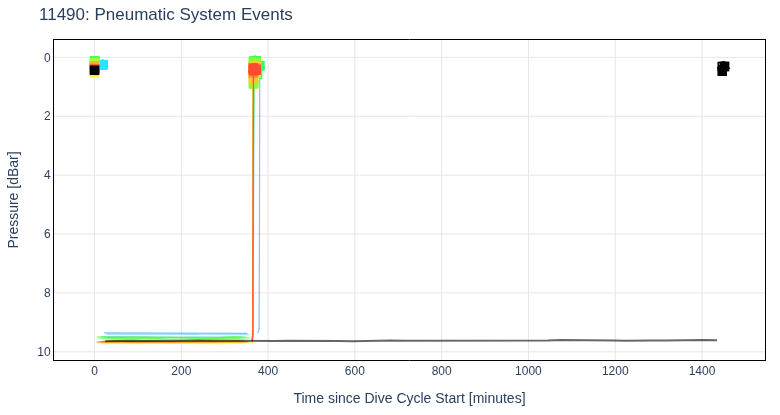
| 37 | Pneumatic System Events | pneumatic | 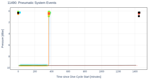 | pneumatic_events .html (135.3kB) .png [780x415] (38.2kB) .png [1600x900] (91.9kB) |
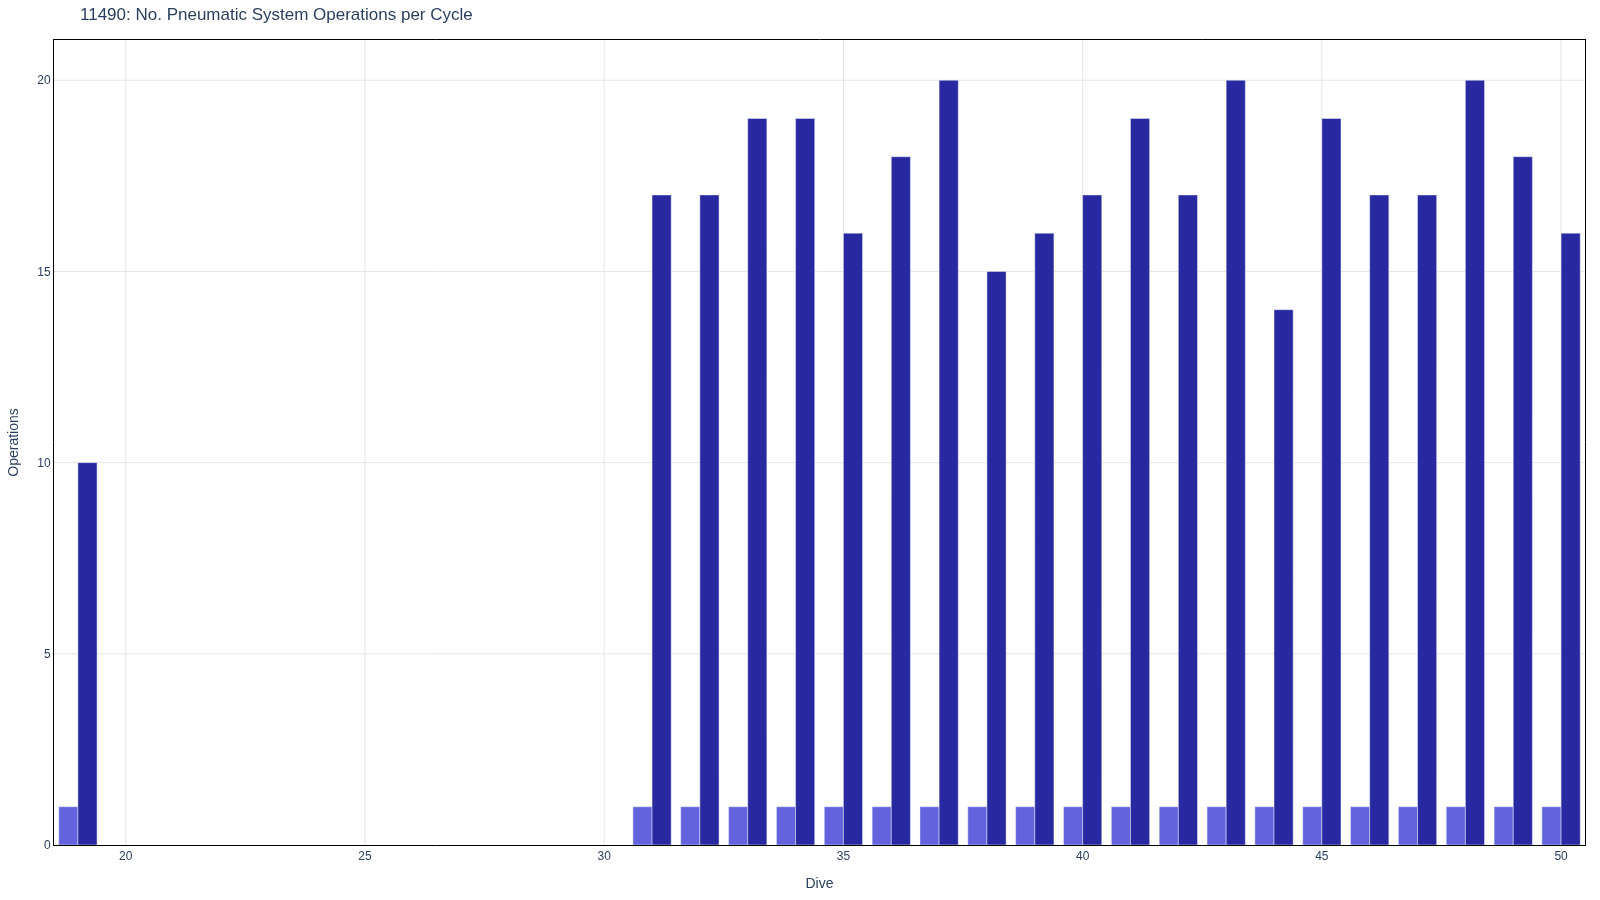
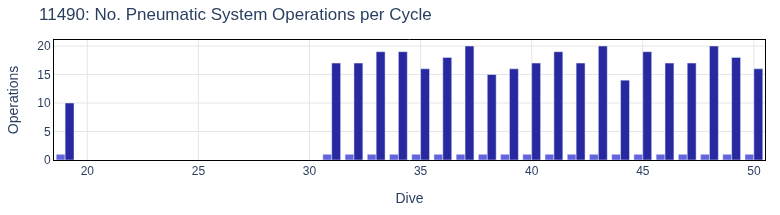
| 38 | No. Pneumatic System Operations per Cycle | pneumatic | 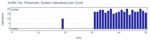 | pneumatic_num_ops .html (8.9kB) .png [780x215] (23.2kB) .png [1600x900] (55.2kB) |
| 39 | Pneumatic System On Time per Cycle | pneumatic |  | pneumatic_on_time .html (9.1kB) .png [780x215] (22.0kB) .png [1600x900] (58.1kB) |
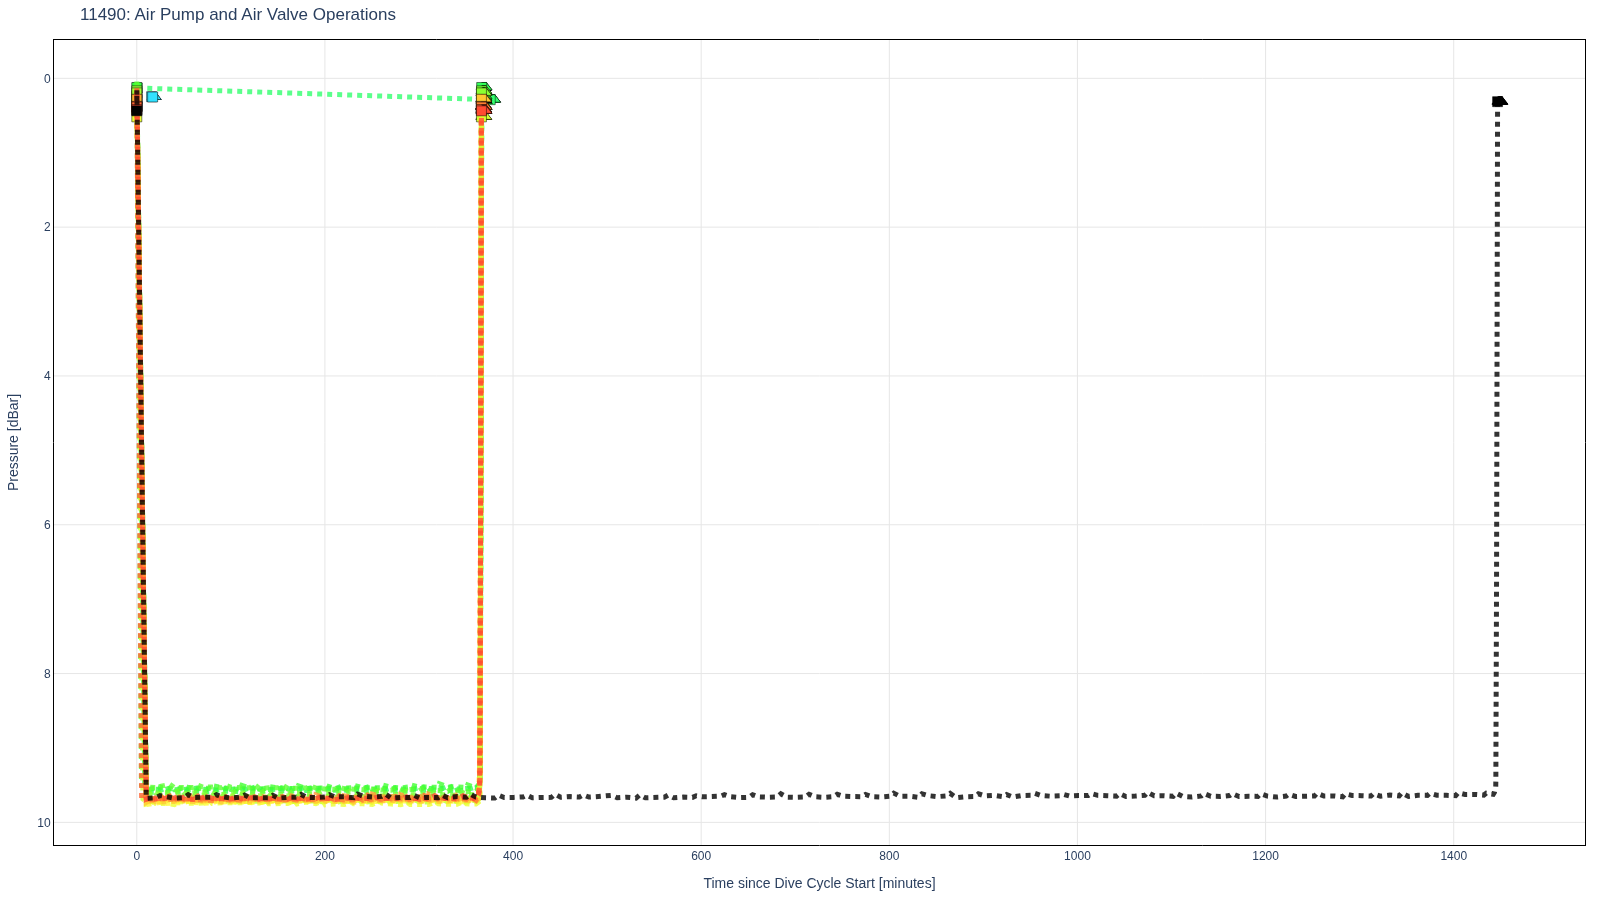
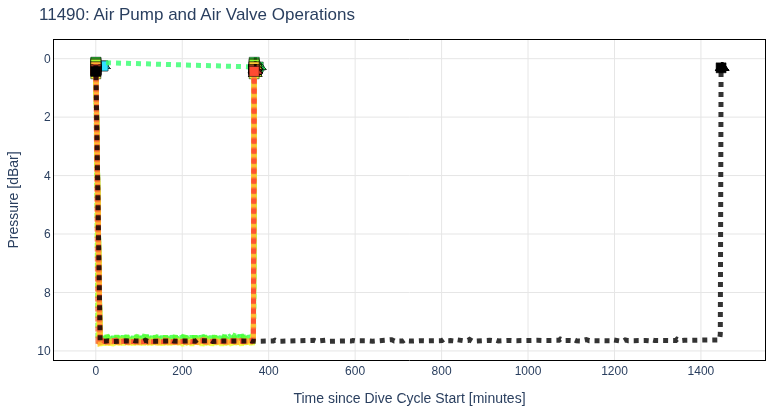
| 40 | Air Pump and Air Valve Operations | pneumatic | 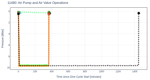 | pneumatic_operations .html (218.1kB) .png [780x415] (49.7kB) .png [1600x900] (123.8kB) |
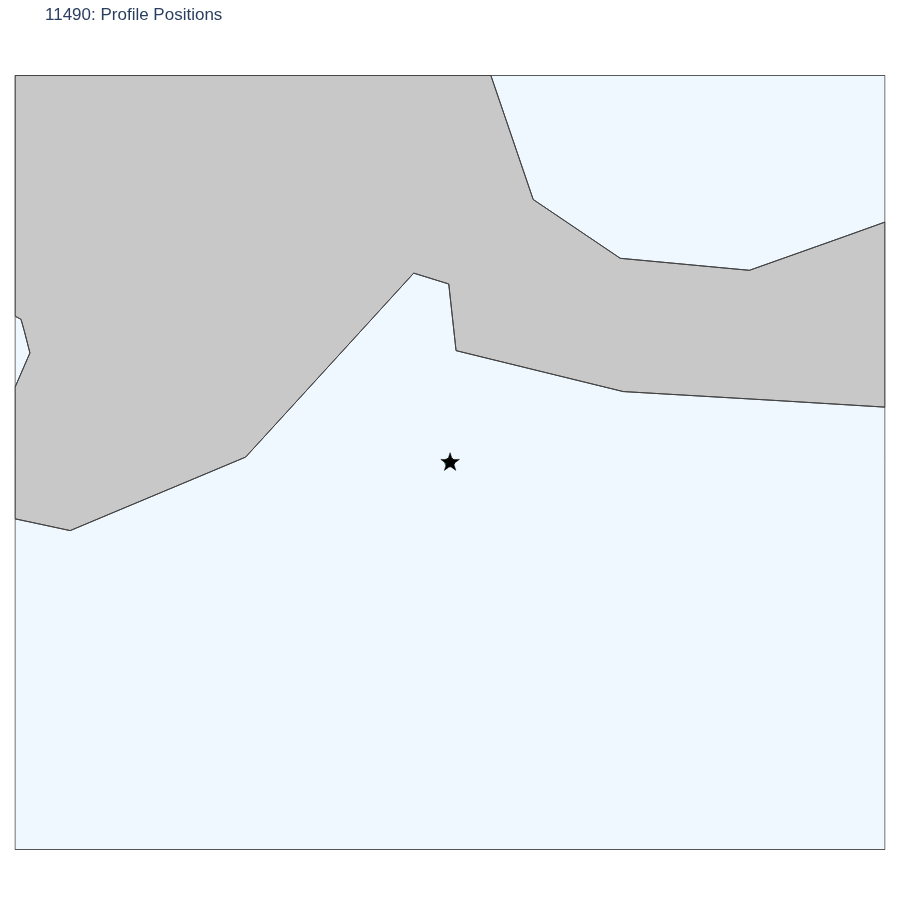
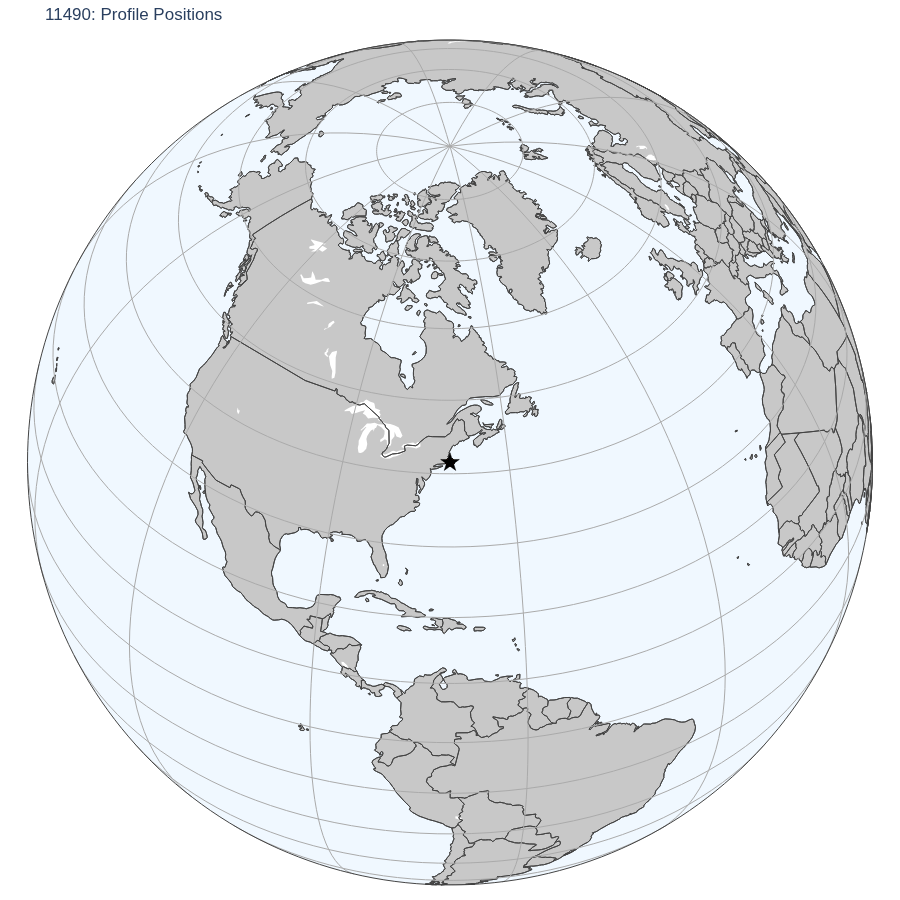
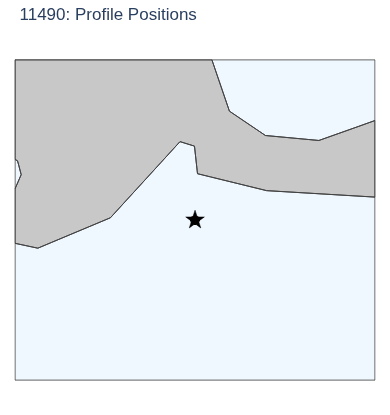
| 41 | Profile Positions | position | 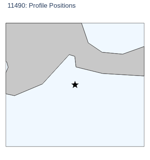 | position .html (18.3kB) .png [390x415] (16.8kB) .png [900x900] (42.7kB) |
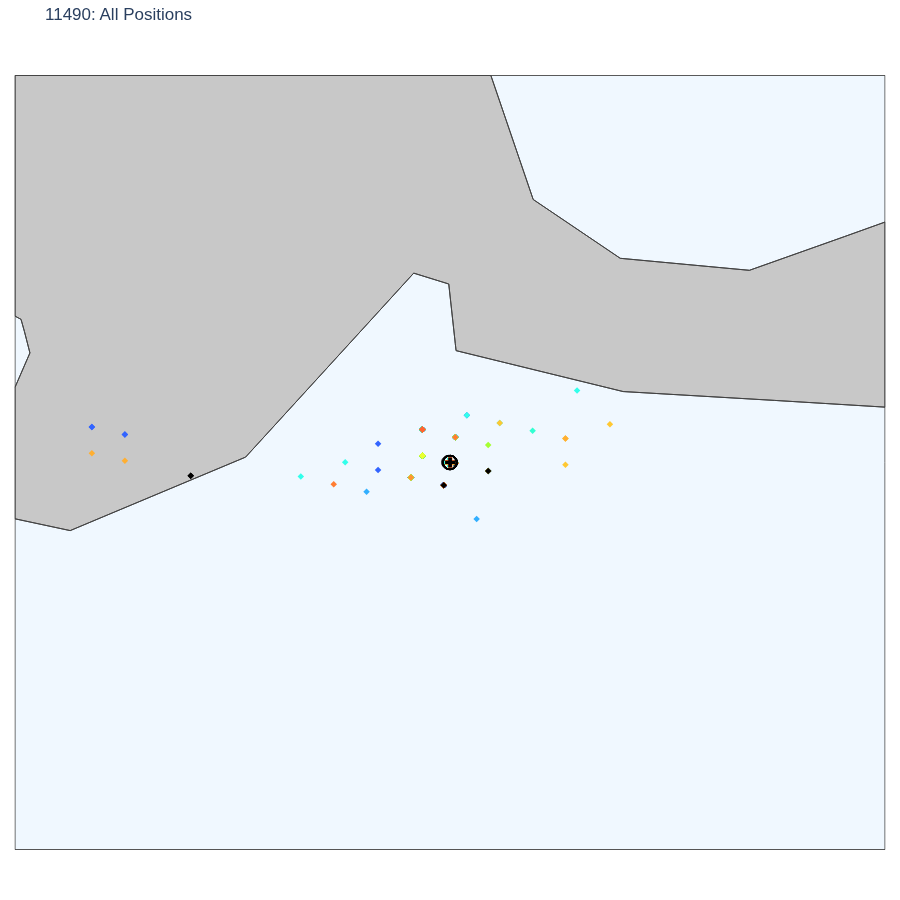
| 42 | All Positions | satcom | 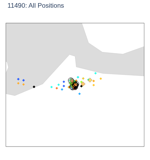 | position_all .html (58.3kB) .png [390x415] (19.0kB) .png [900x900] (45.3kB) |
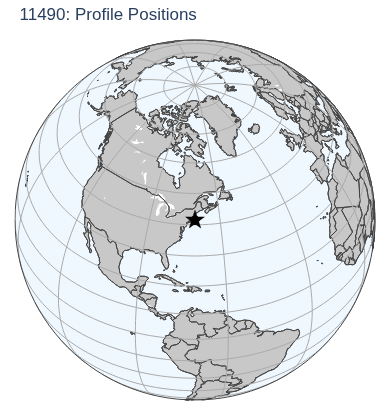
| 43 | Profile Positions | position | 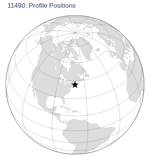 | position_globe .html (18.2kB) .png [390x415] (116.2kB) .png [900x900] (333.6kB) |
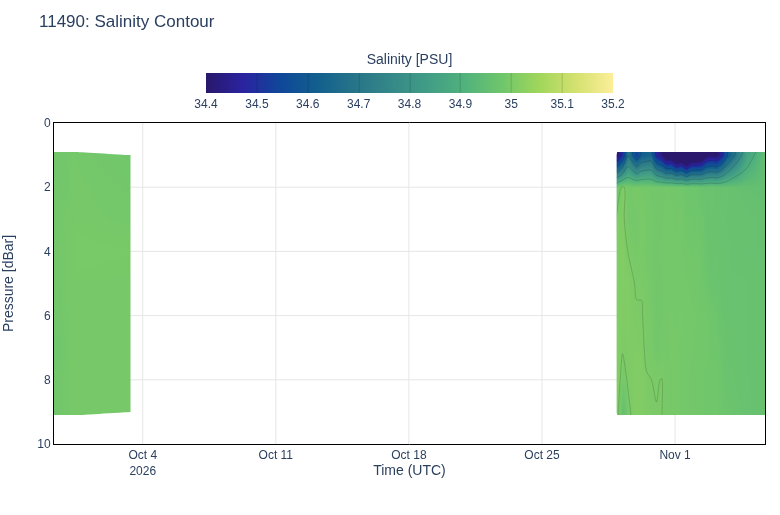
| 44 | Salinity Contour | profile_contour |  | profile_contour_saln .html (14.0kB) .png [780x515] (43.2kB) .png [1600x900] (86.0kB) |
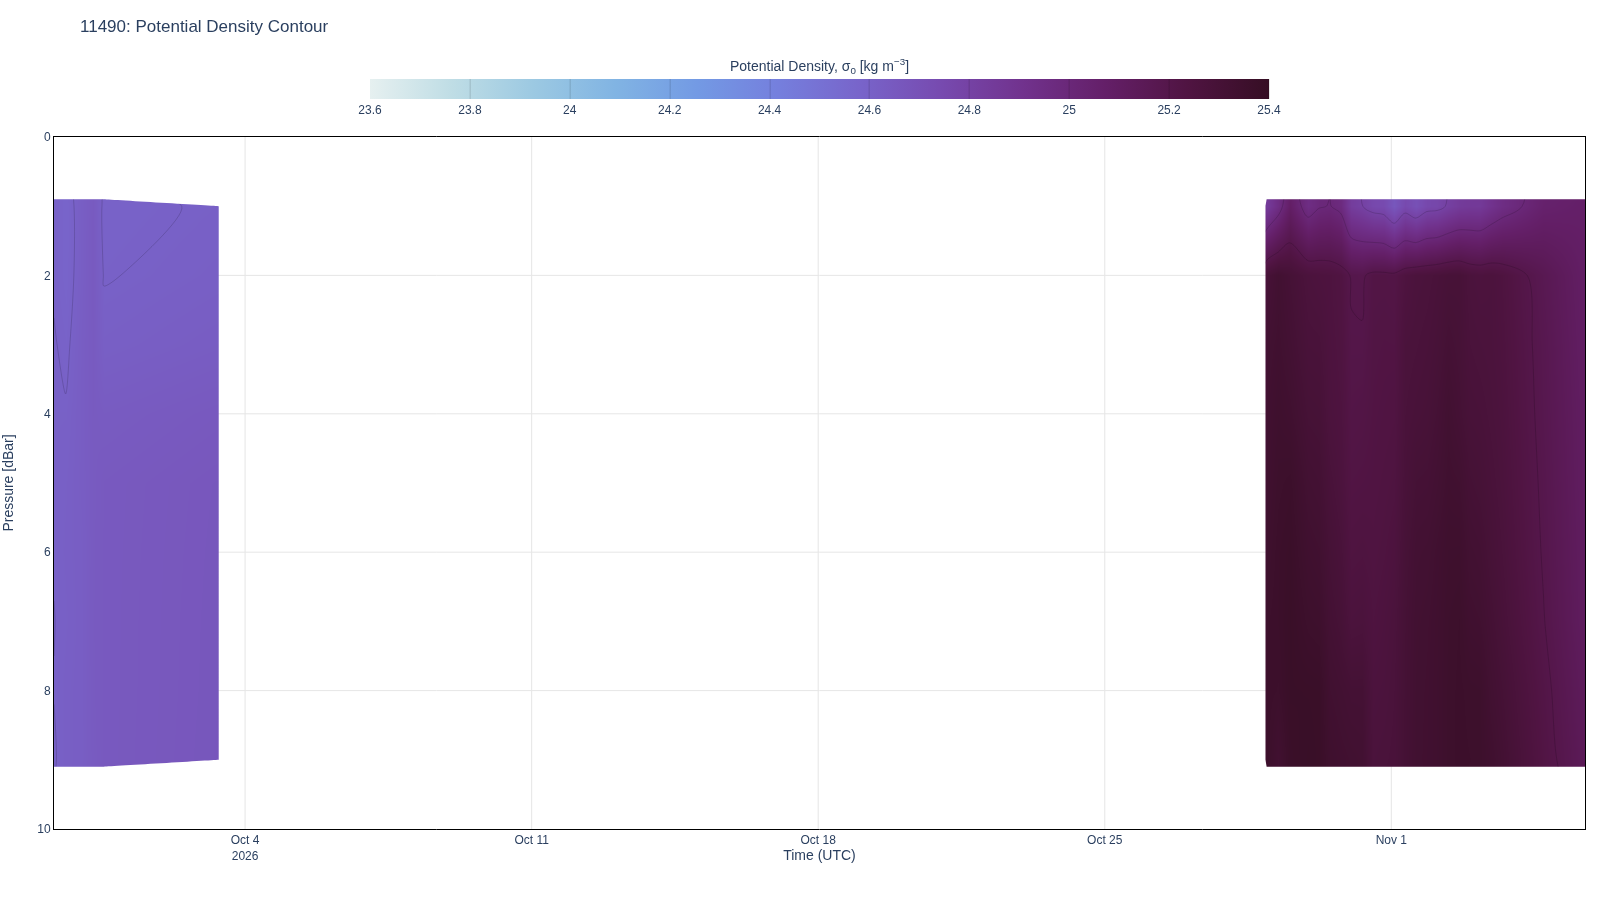
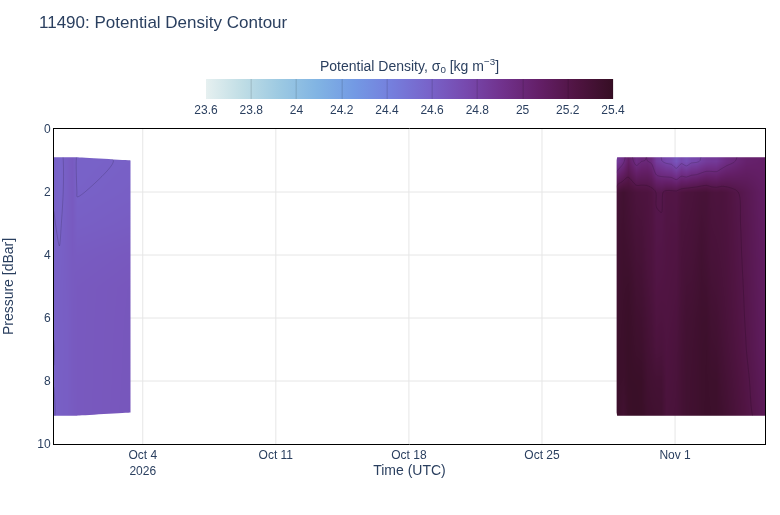
| 45 | Potential Density Contour | profile_contour | 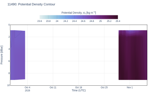 | profile_contour_sigma0 .html (14.1kB) .png [780x515] (48.8kB) .png [1600x900] (95.2kB) |
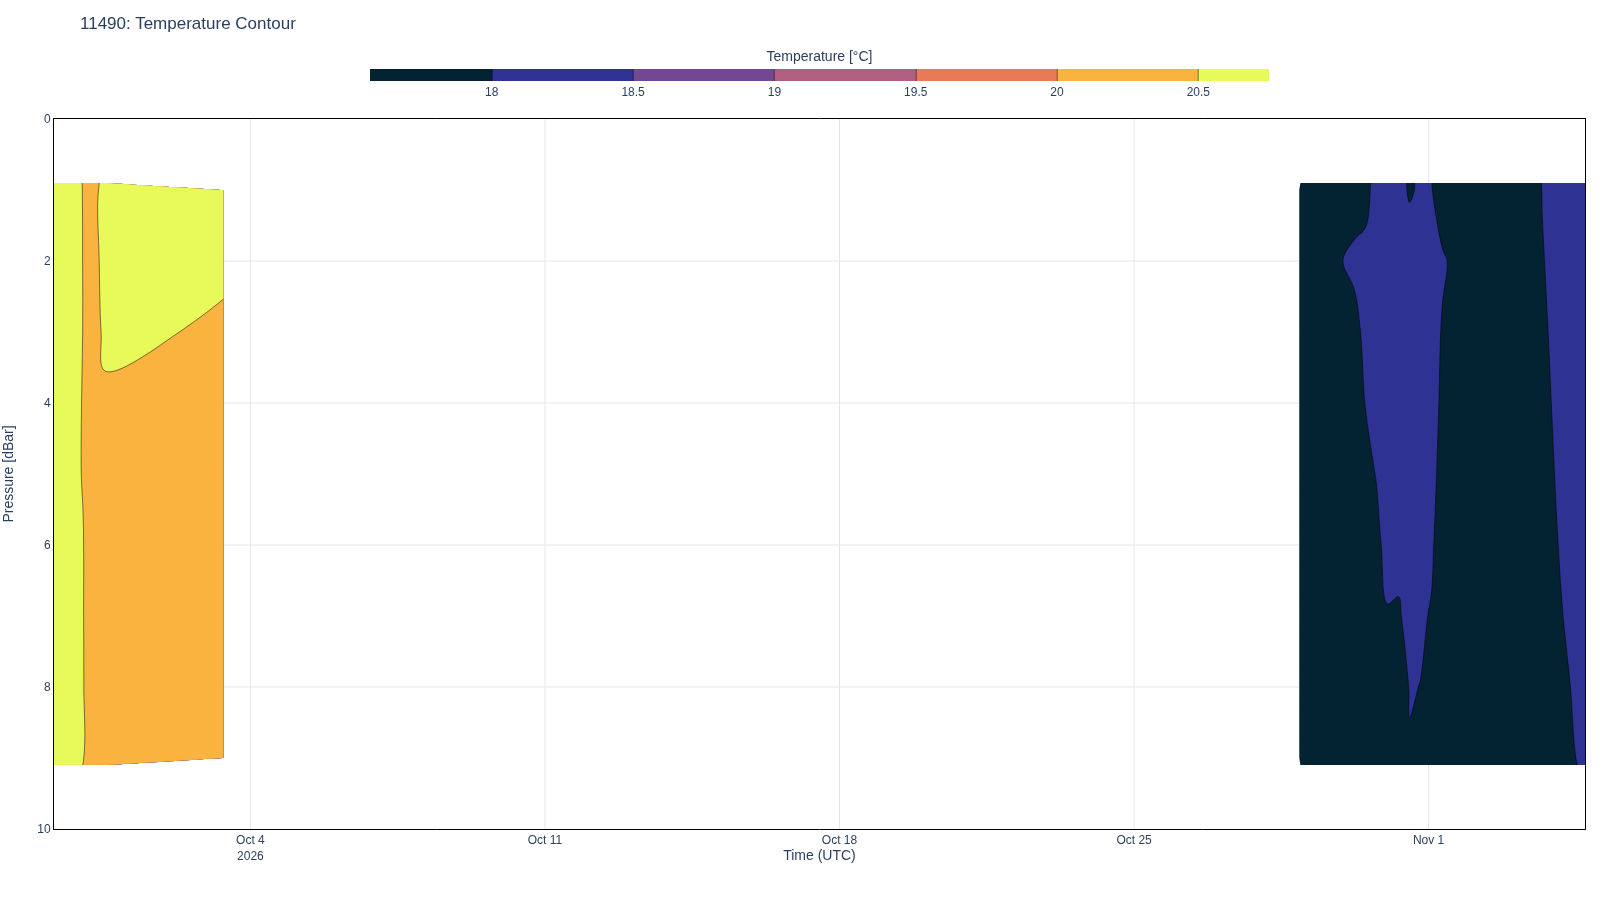
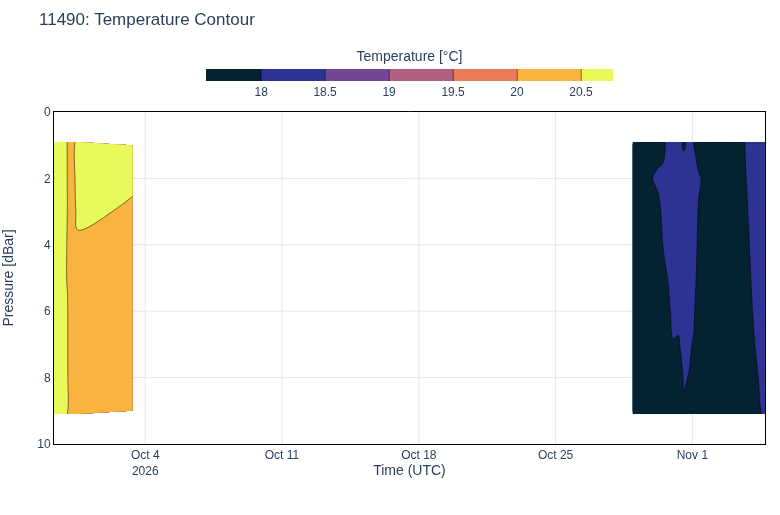
| 46 | Temperature Contour | profile_contour | 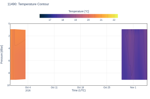 | profile_contour_temp .html (14.0kB) .png [780x515] (38.9kB) .png [1600x900] (79.1kB) |
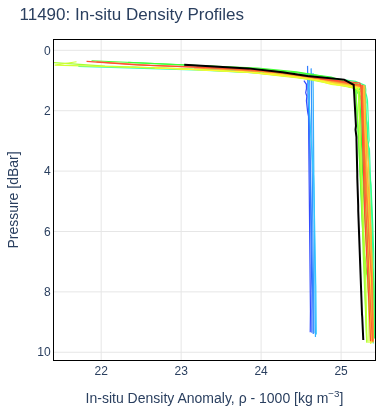
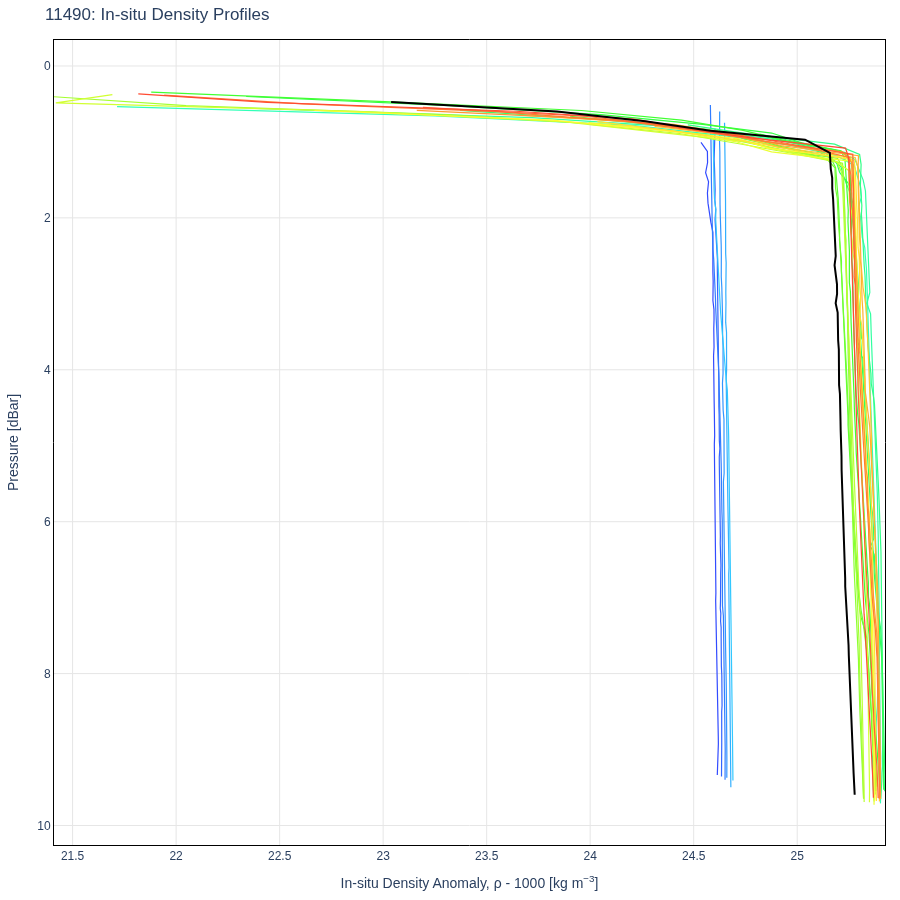
| 47 | In-situ Density Profiles | profile | 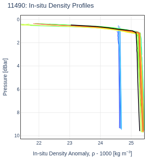 | profile_dens .html (222.5kB) .png [390x415] (41.5kB) .png [900x900] (138.5kB) |
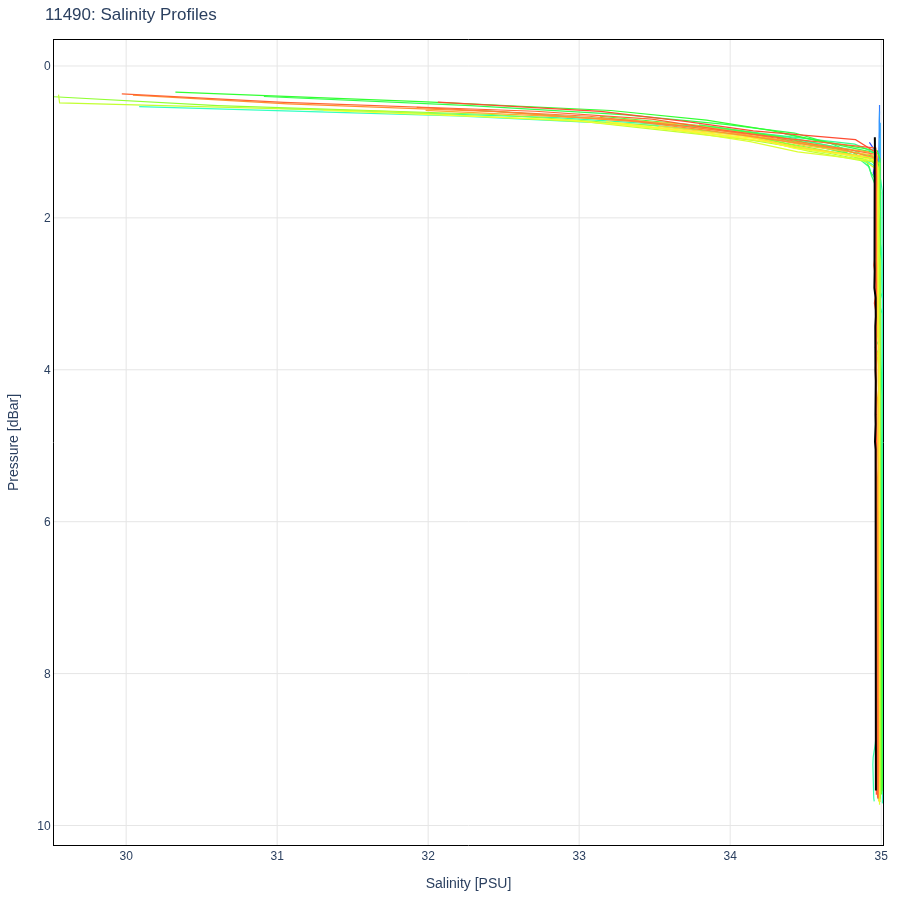
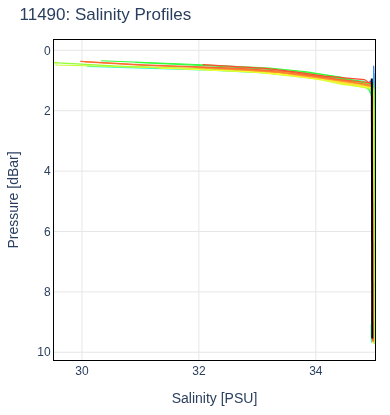
| 48 | Salinity Profiles | profile | 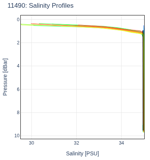 | profile_saln .html (193.4kB) .png [390x415] (26.9kB) .png [900x900] (83.3kB) |
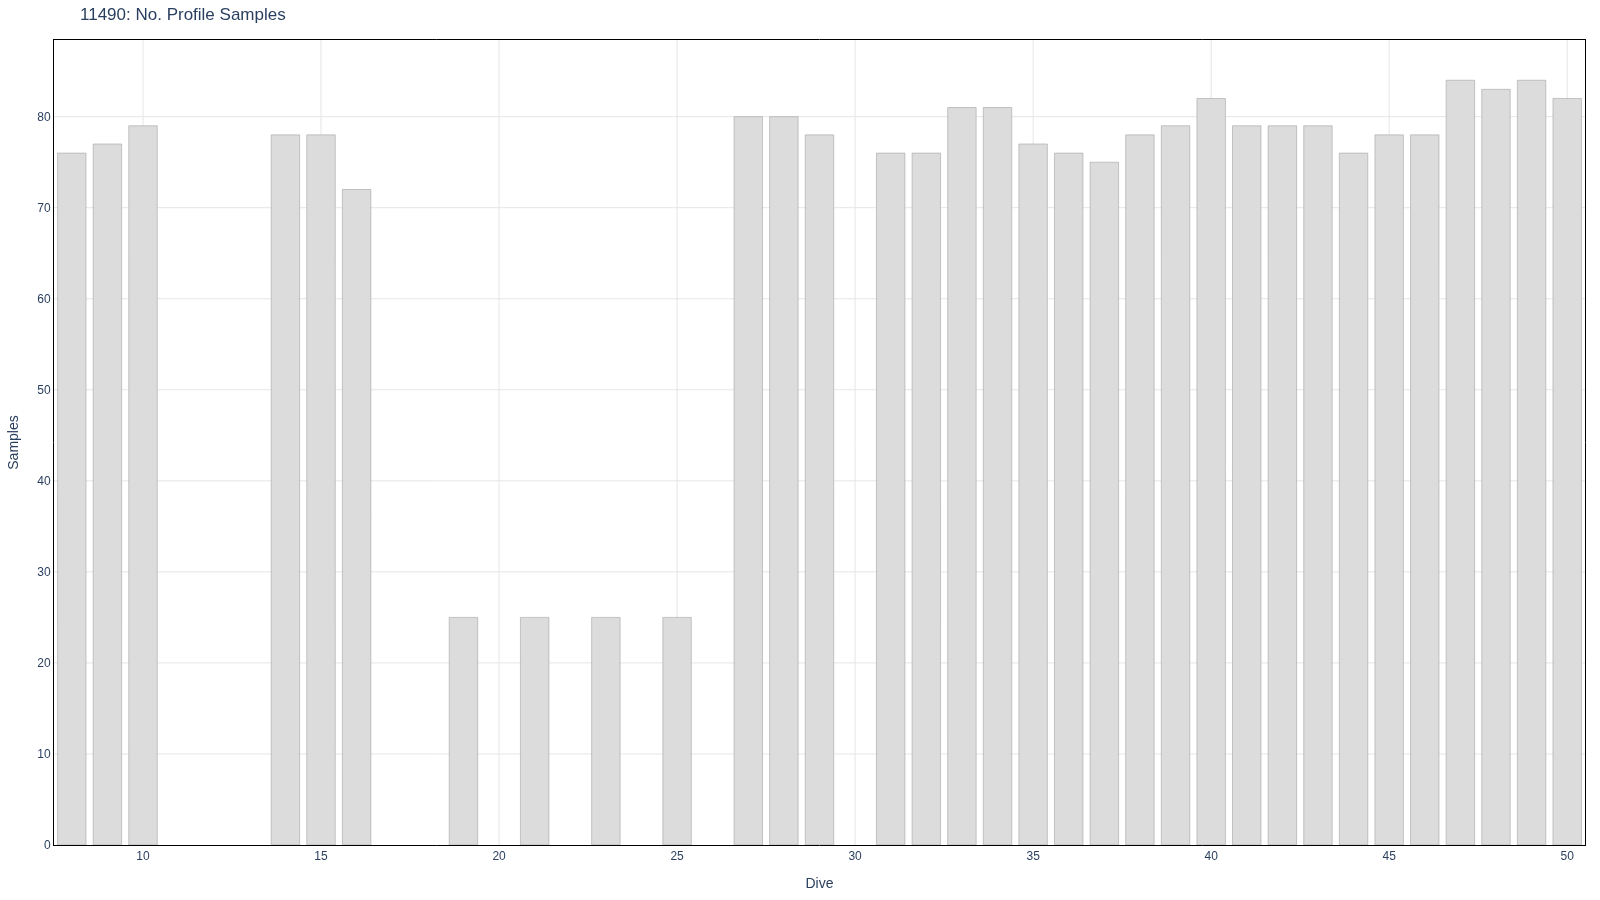
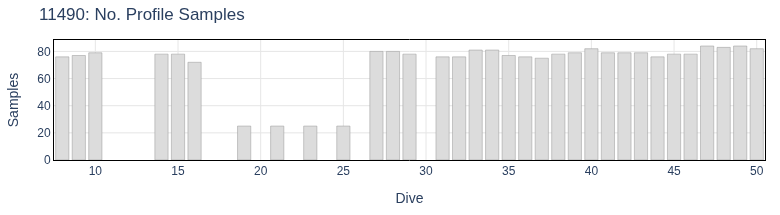
| 49 | No. Profile Samples | profile | 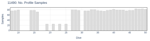 | profile_sample_count .html (8.6kB) .png [780x215] (21.1kB) .png [1600x900] (57.1kB) |
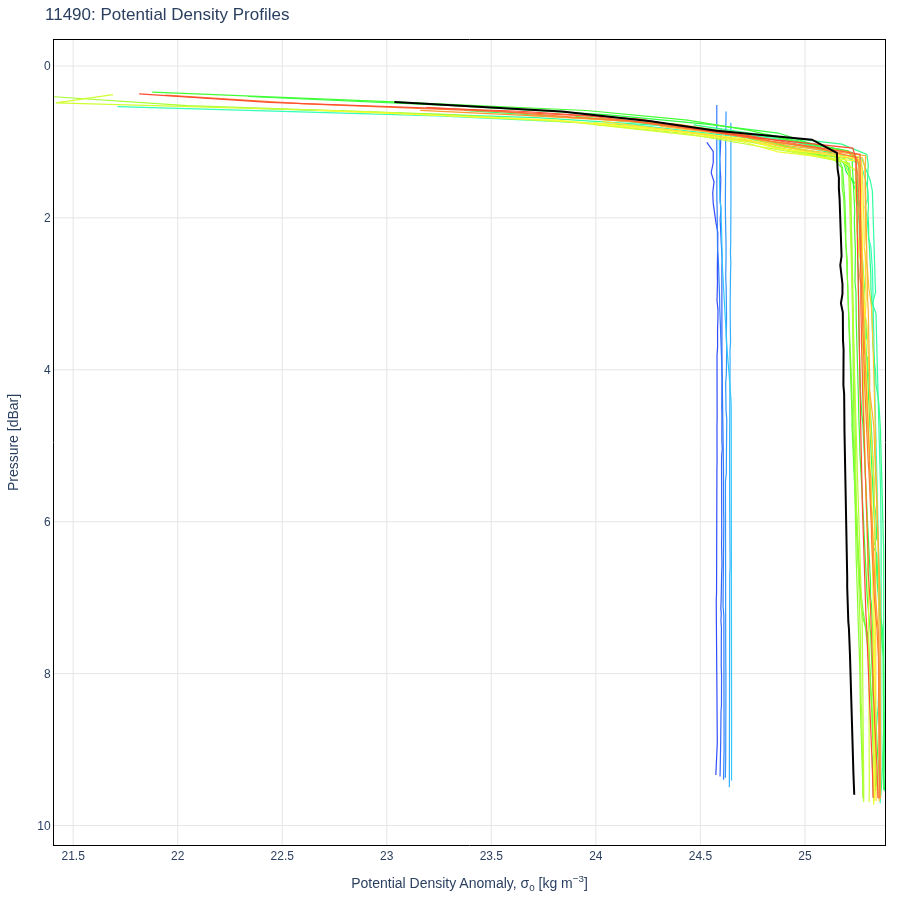
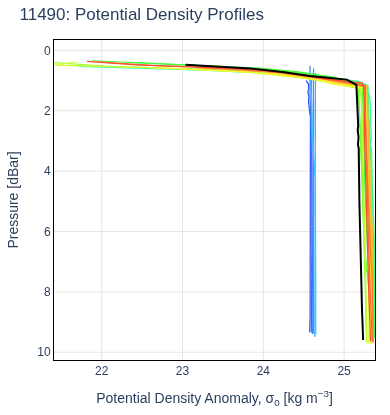
| 50 | Potential Density Profiles | profile | 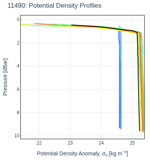 | profile_sigma0 .html (192.8kB) .png [390x415] (40.5kB) .png [900x900] (134.3kB) |
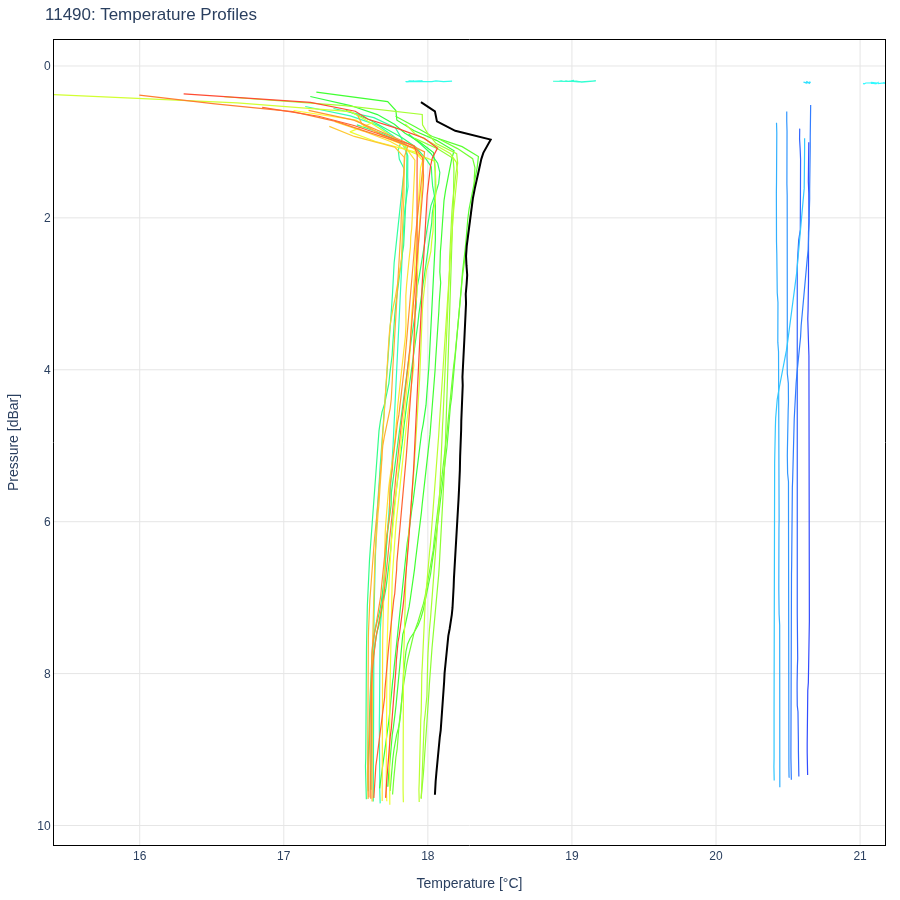
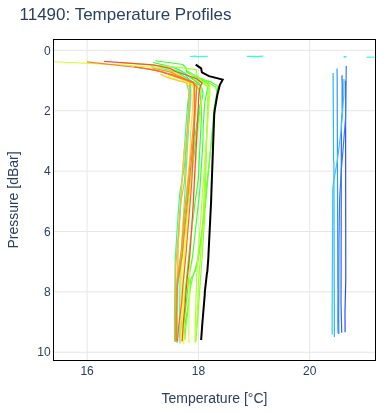
| 51 | Temperature Profiles | profile | 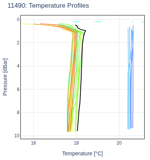 | profile_temp .html (193.1kB) .png [390x415] (47.2kB) .png [900x900] (147.2kB) |
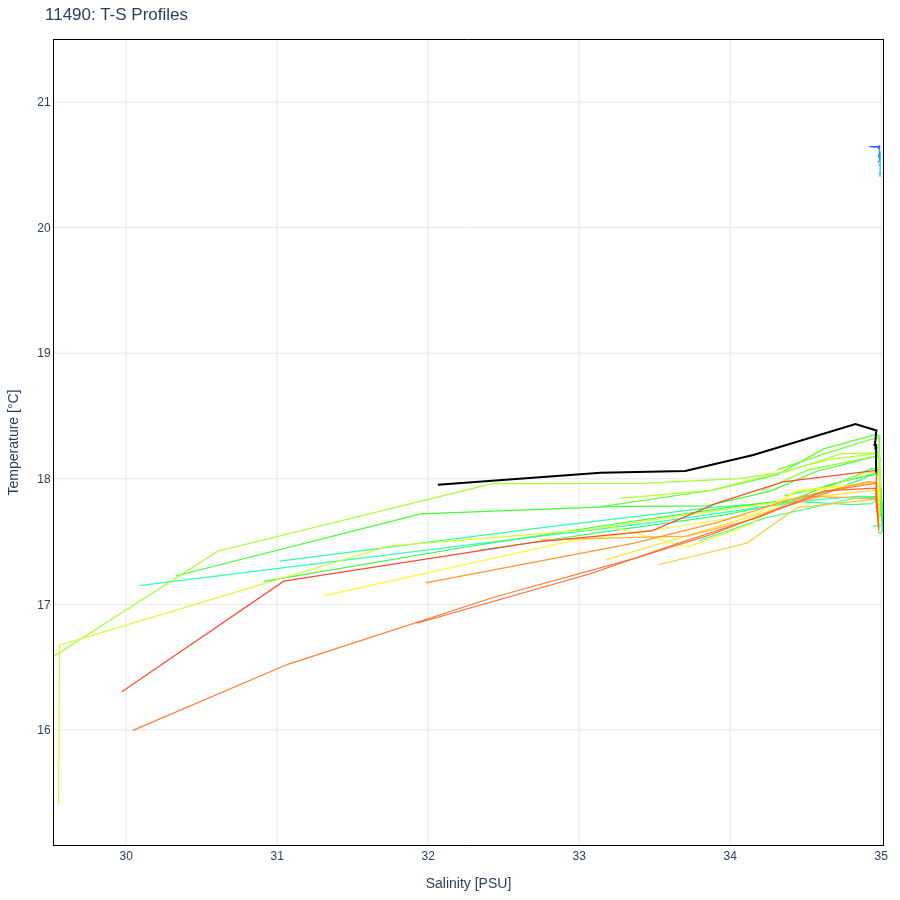
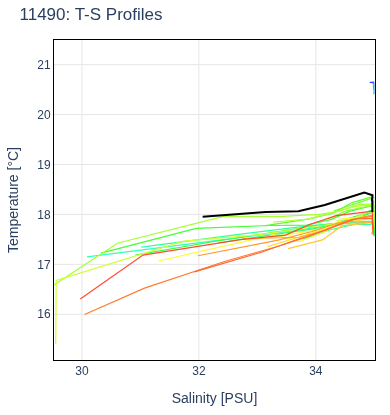
| 52 | T-S Profiles | profile | 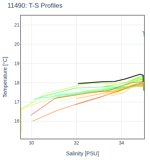 | profile_ts .html (192.3kB) .png [390x415] (40.1kB) .png [900x900] (115.0kB) |
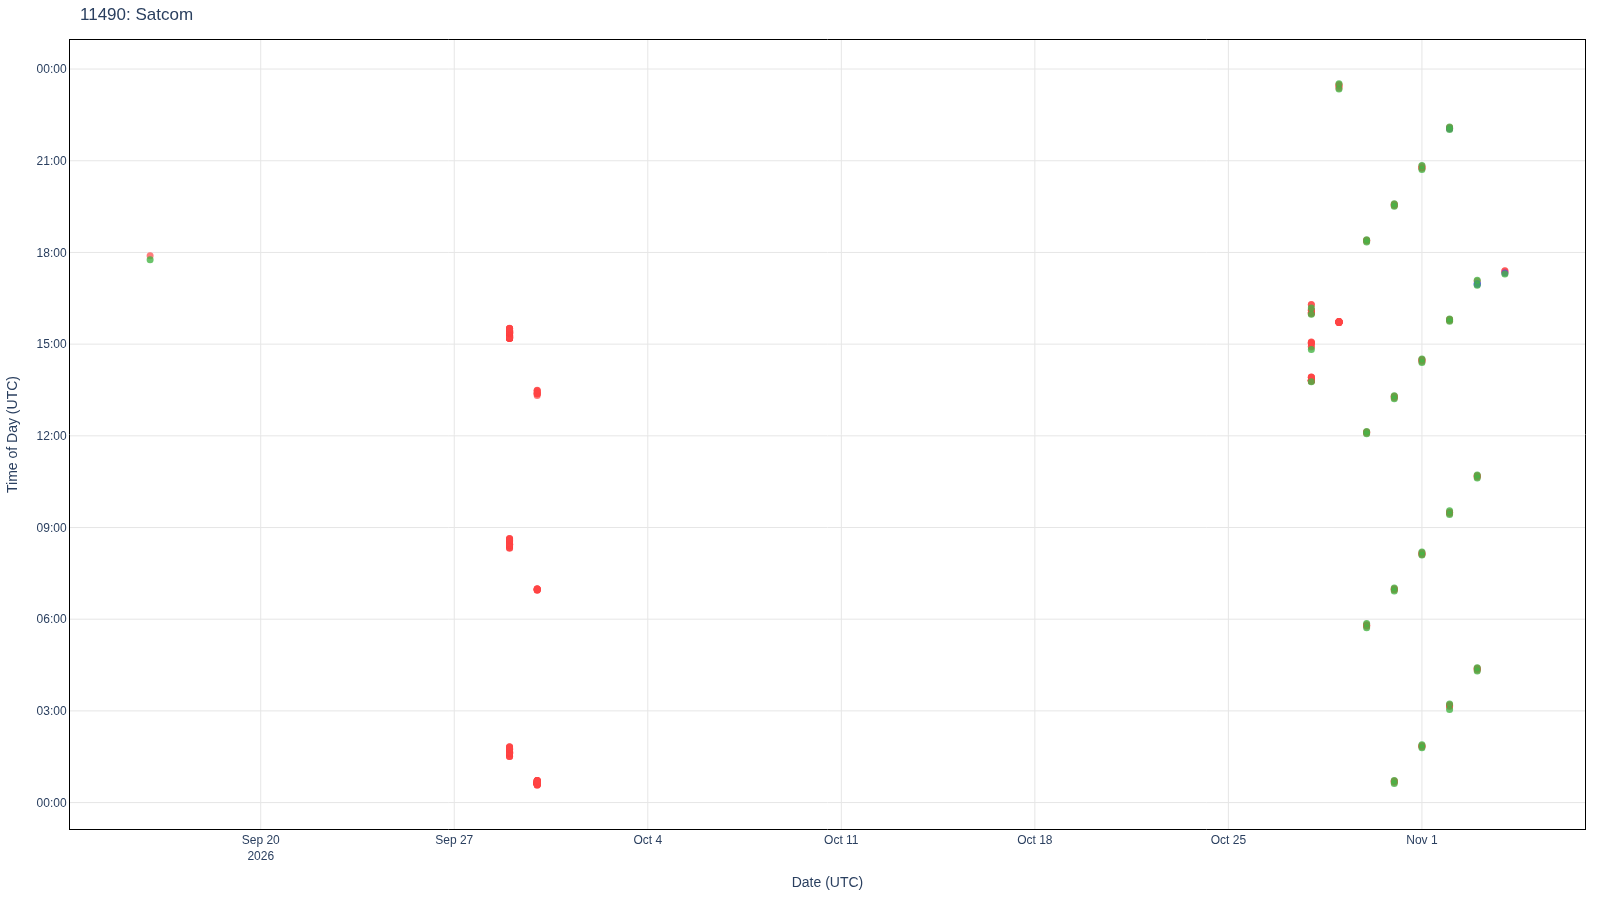
| 53 | Satcom | satcom | 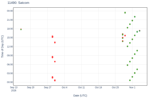 | satcom .html (33.5kB) .png [780x515] (40.3kB) .png [1600x900] (67.5kB) |
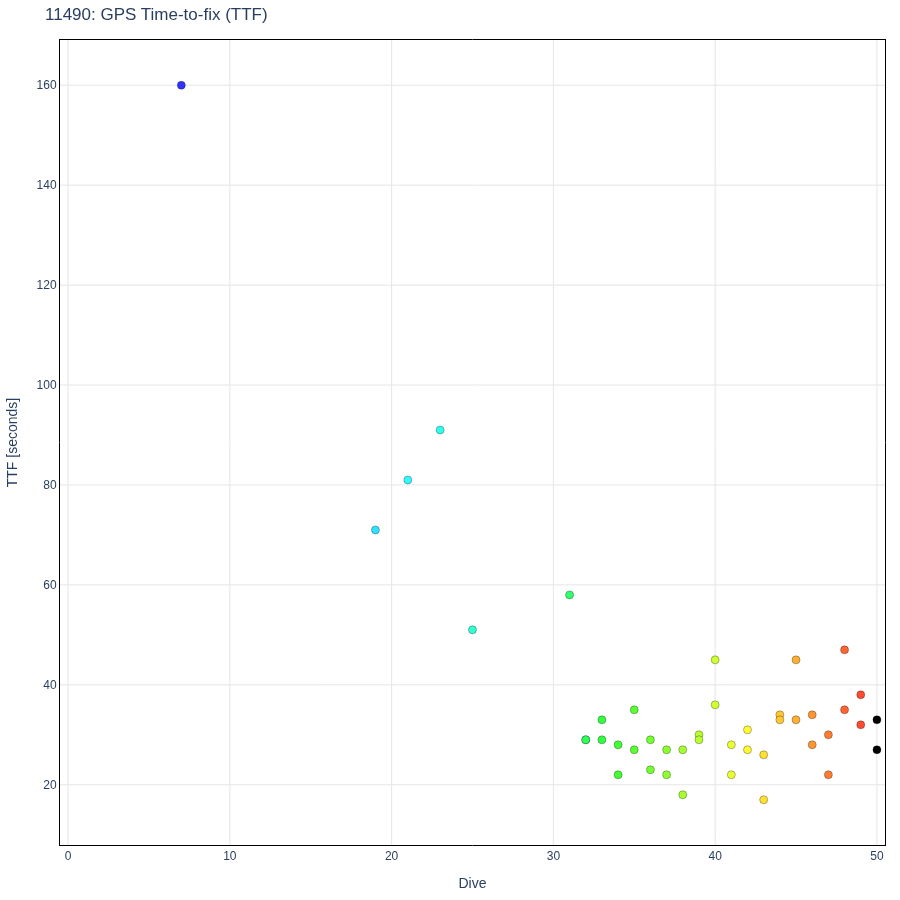
| 54 | GPS Time-to-fix (TTF) | satcom | 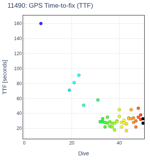 | satcom_gps_ttf .html (20.4kB) .png [390x415] (22.1kB) .png [900x900] (42.4kB) |
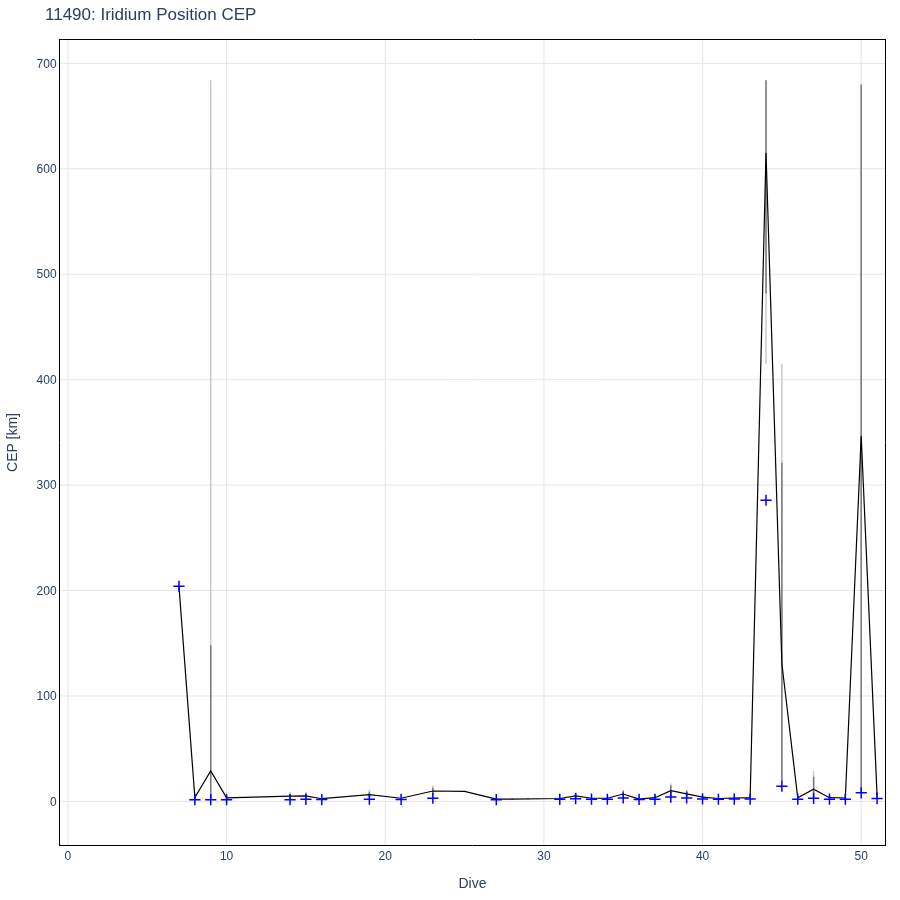
| 55 | Iridium Position CEP | satcom | 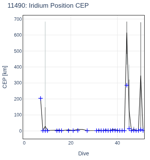 | satcom_iridium_cep_avg .html (12.6kB) .png [390x415] (30.2kB) .png [900x900] (86.7kB) |
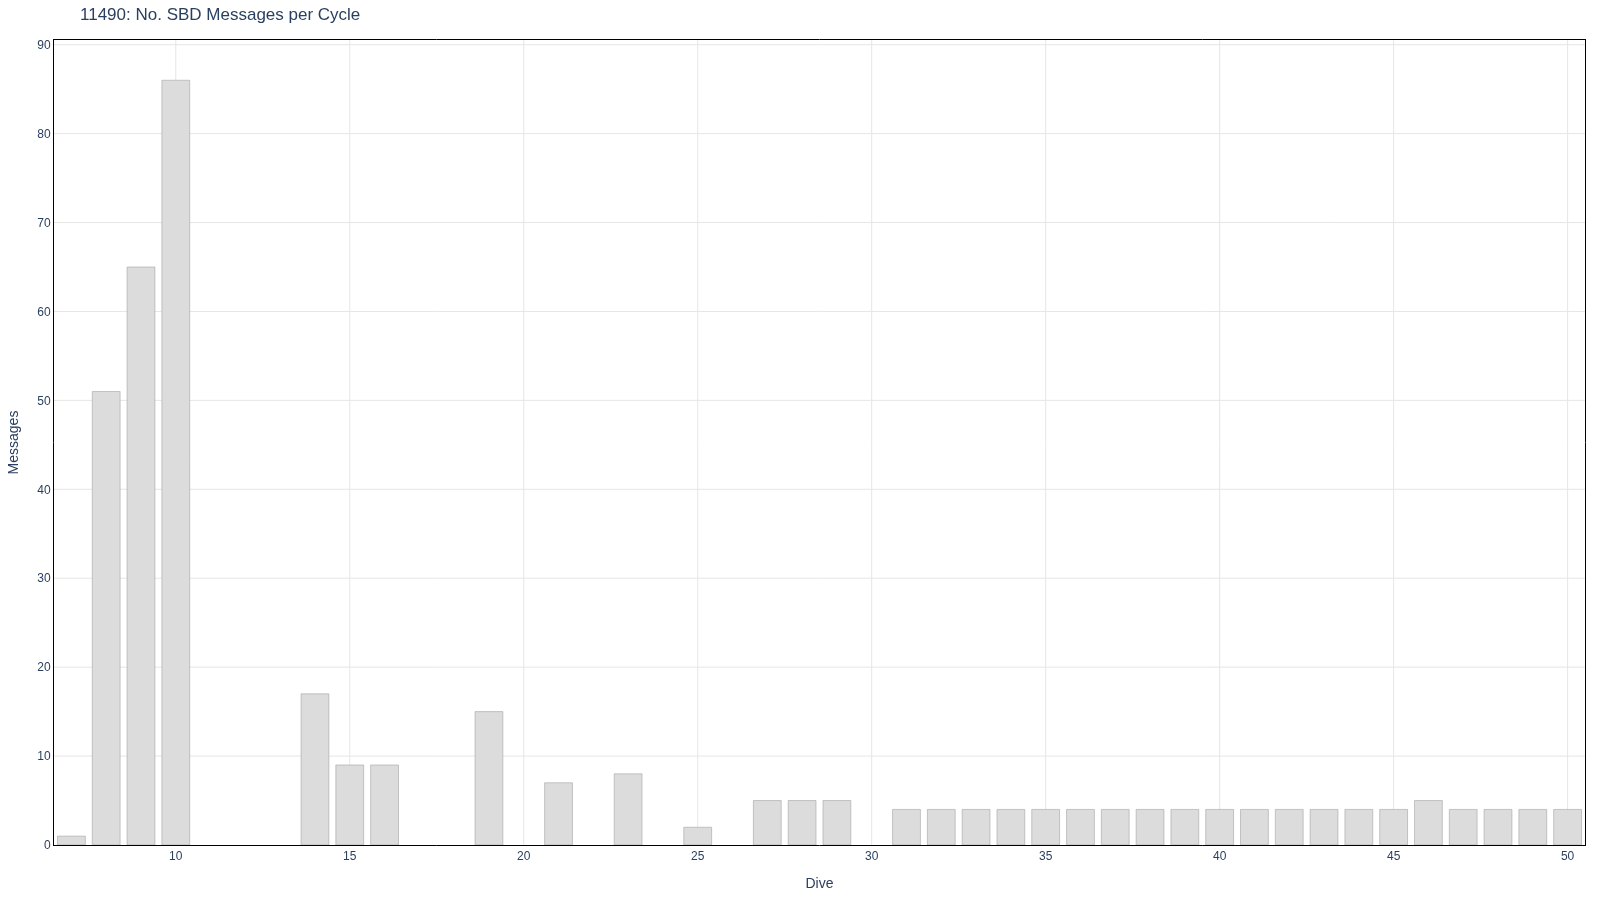
| 56 | No. SBD Messages per Cycle | satcom | 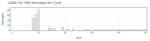 | satcom_sbd_count .html (8.6kB) .png [780x215] (21.4kB) .png [1600x900] (54.7kB) |
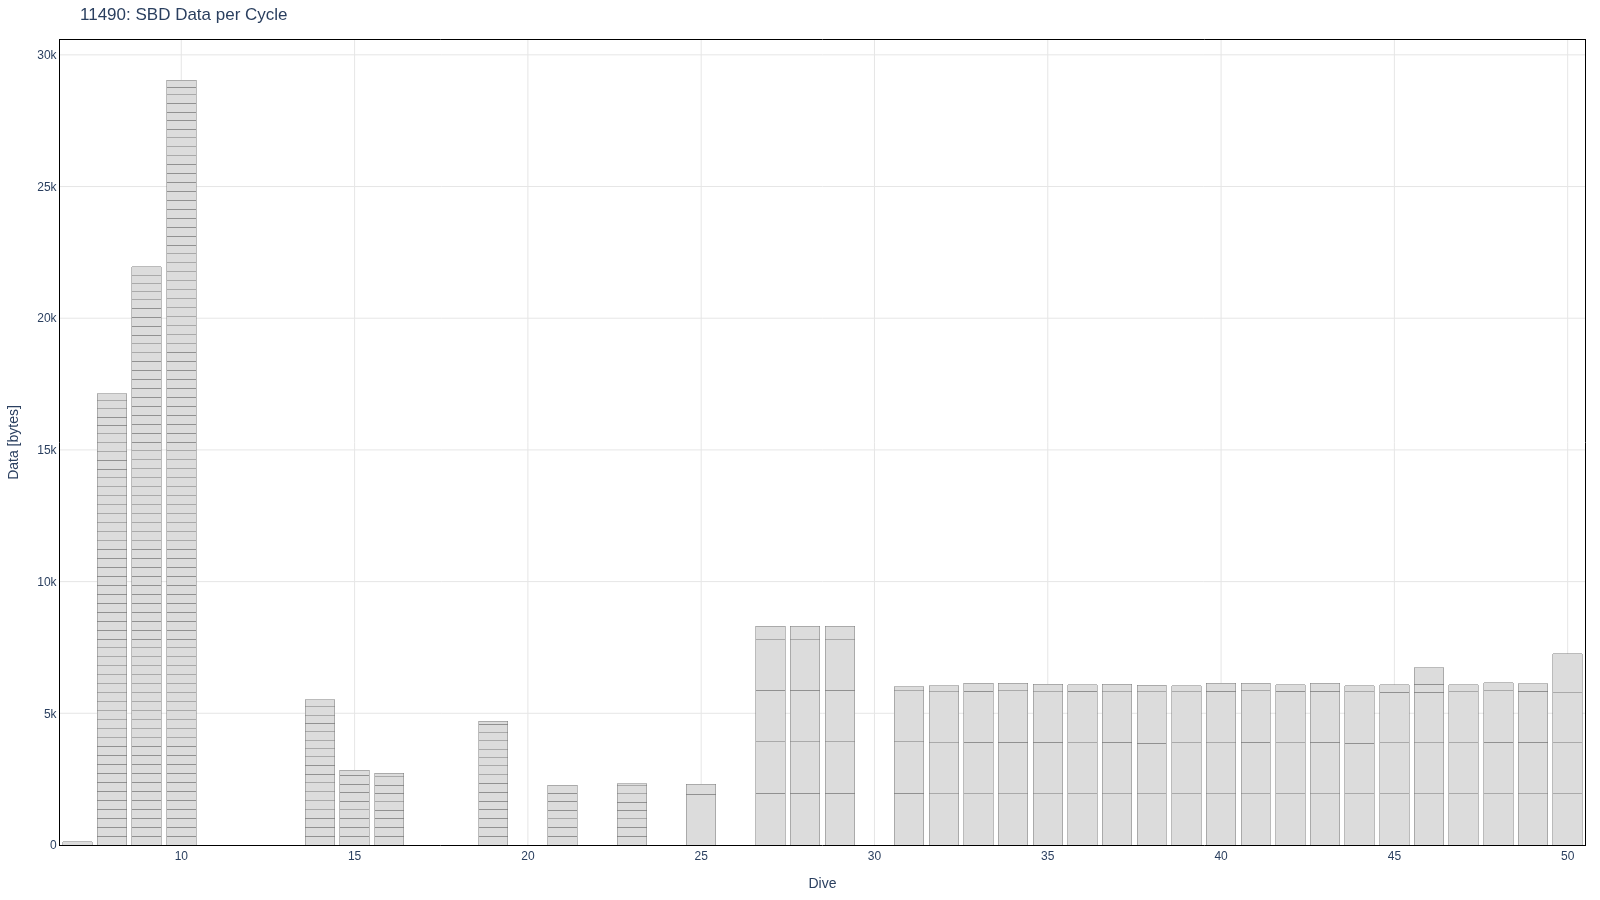
| 57 | SBD Data per Cycle | satcom | 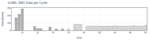 | satcom_sbd_data_size .html (66.0kB) .png [780x215] (20.1kB) .png [1600x900] (56.4kB) |
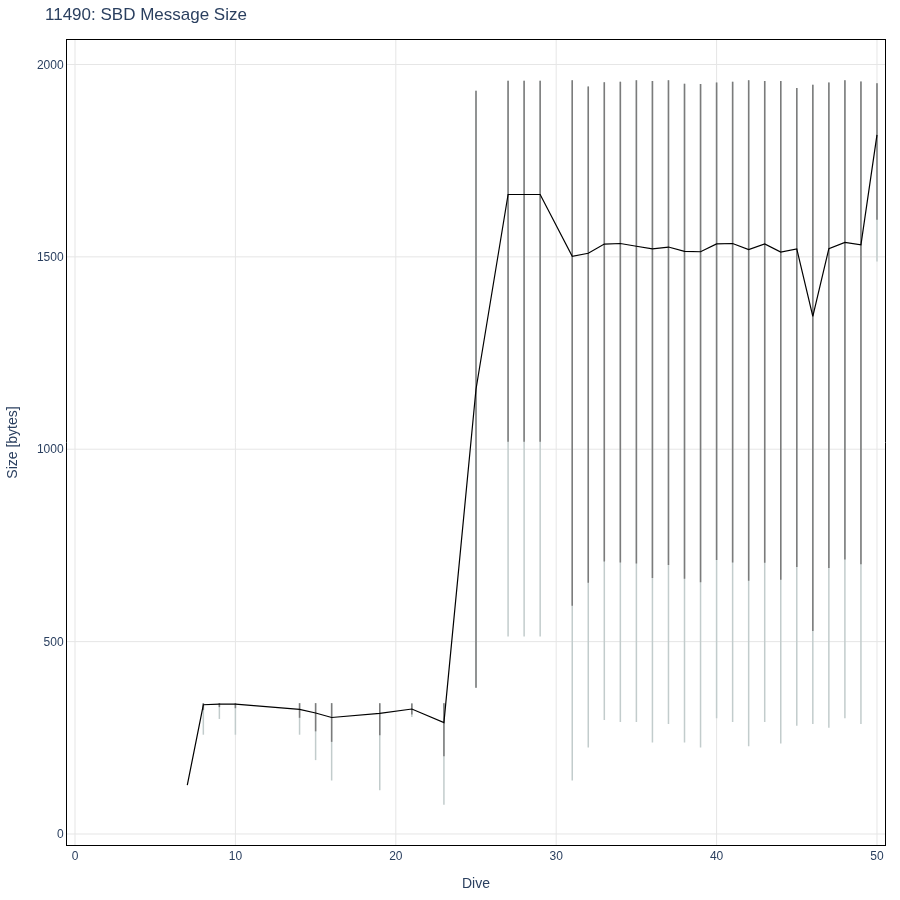
| 58 | SBD Message Size | satcom | 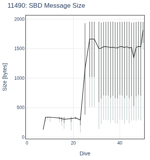 | satcom_sbd_data_size_avg .html (12.8kB) .png [390x415] (34.1kB) .png [900x900] (81.1kB) |
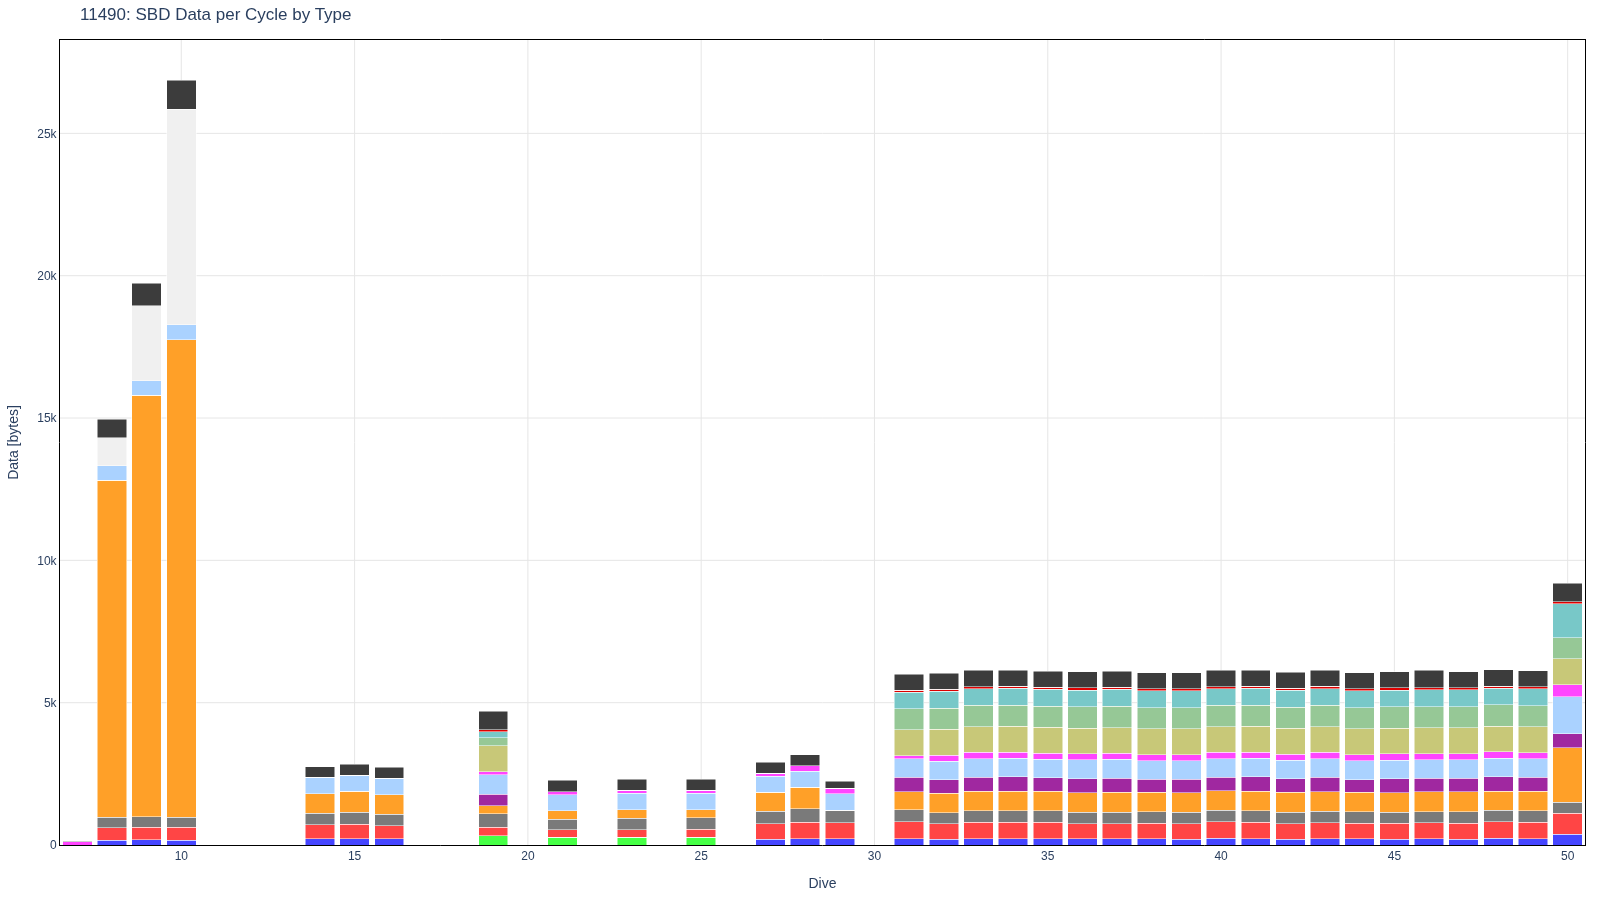
| 59 | SBD Data per Cycle by Type | satcom | 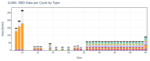 | satcom_sbd_data_types .html (30.7kB) .png [780x315] (25.6kB) .png [1600x900] (55.9kB) |
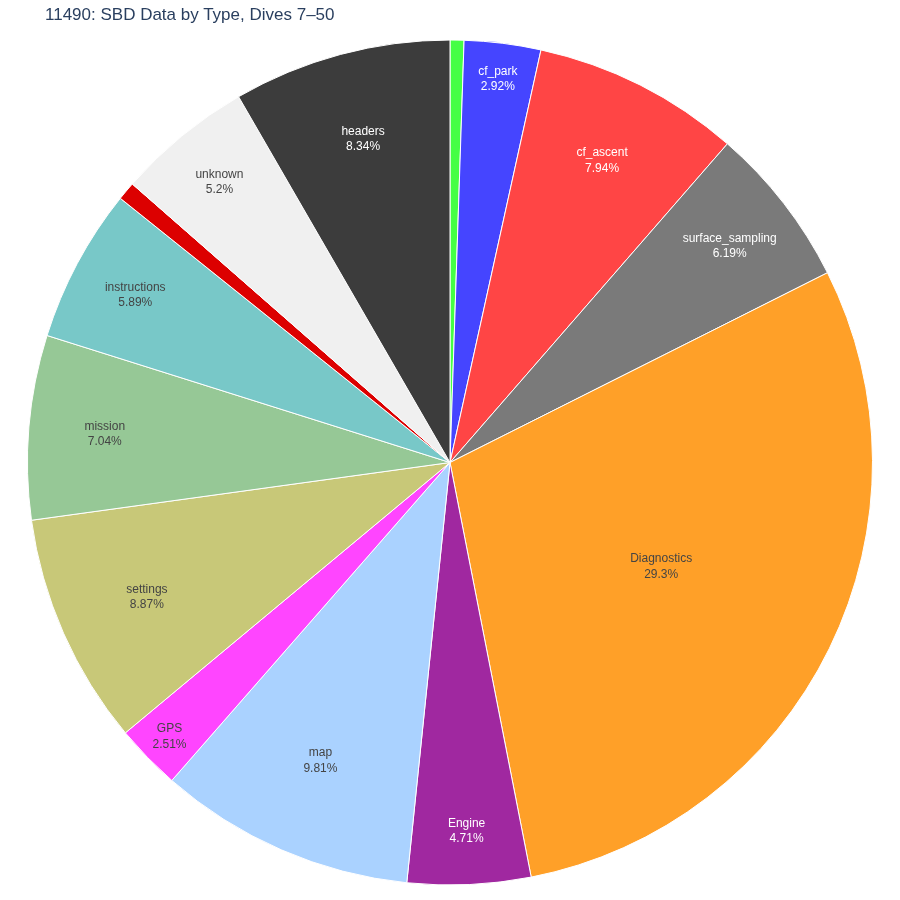
| 60 | SBD Data by Type, Dives 7–50 | satcom | 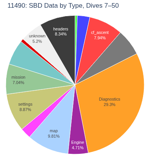 | satcom_sbd_data_types_pie .html (8.8kB) .png [390x415] (49.0kB) .png [900x900] (116.6kB) |
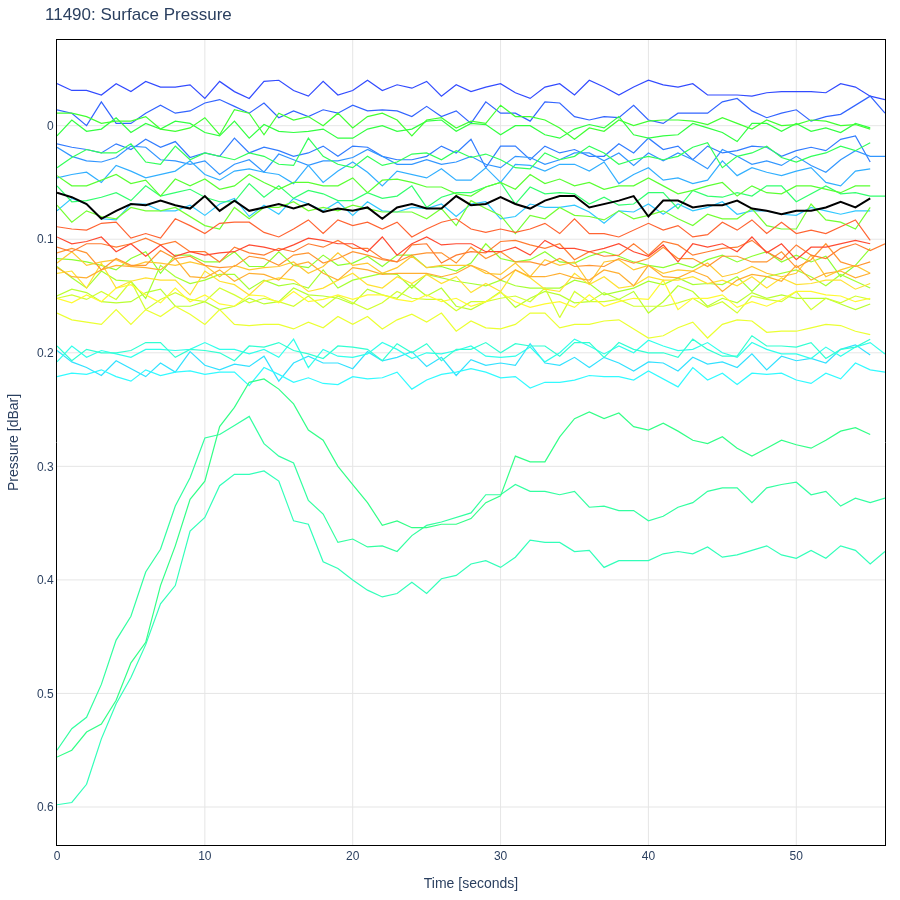
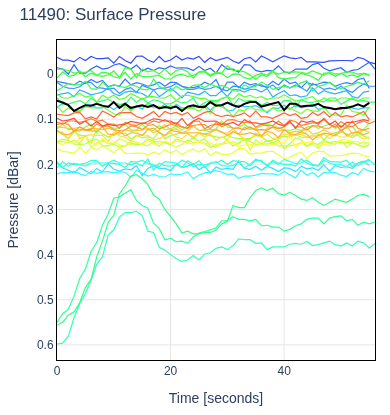
| 61 | Surface Pressure | surface | 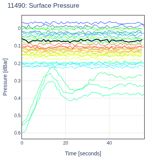 | surface_pres .html (188.7kB) .png [390x415] (102.9kB) .png [900x900] (294.5kB) |
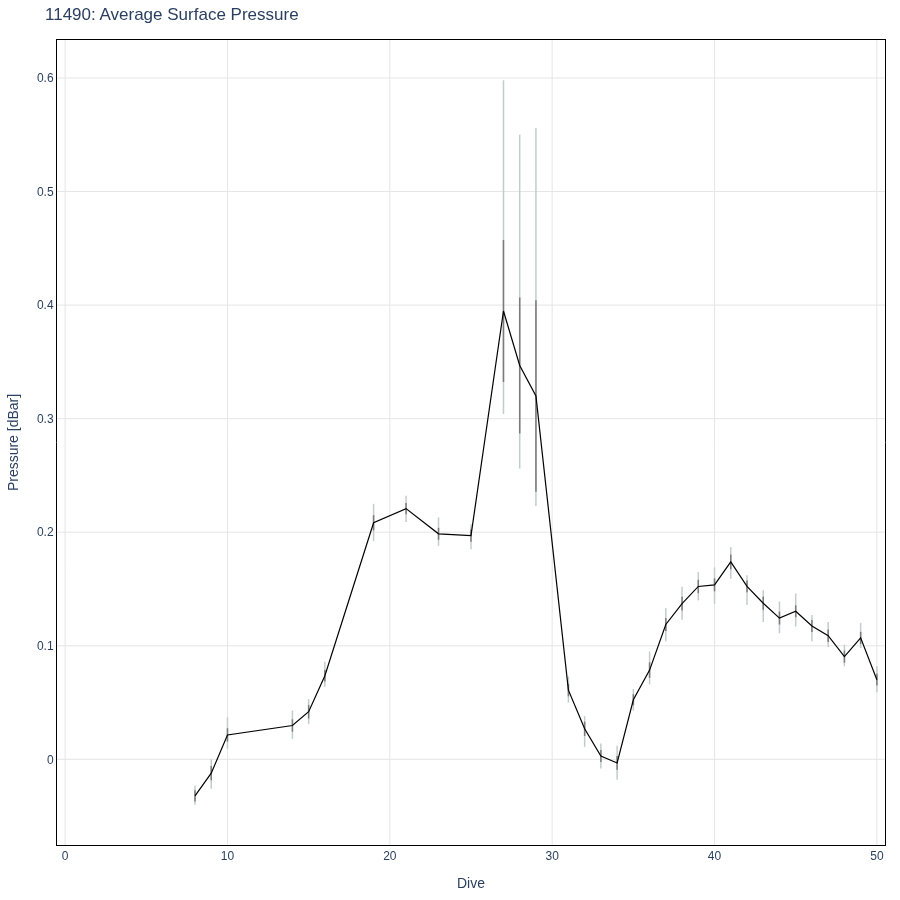
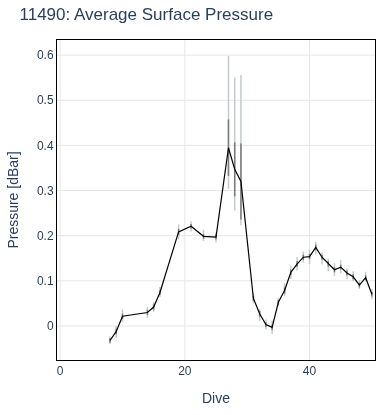
| 62 | Average Surface Pressure | surface | 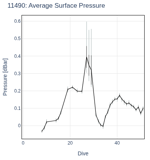 | surface_pres_avg .html (13.3kB) .png [390x415] (37.7kB) .png [900x900] (102.0kB) |
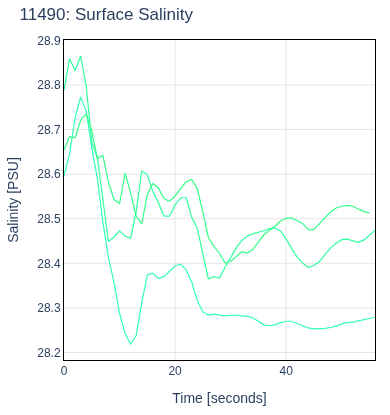
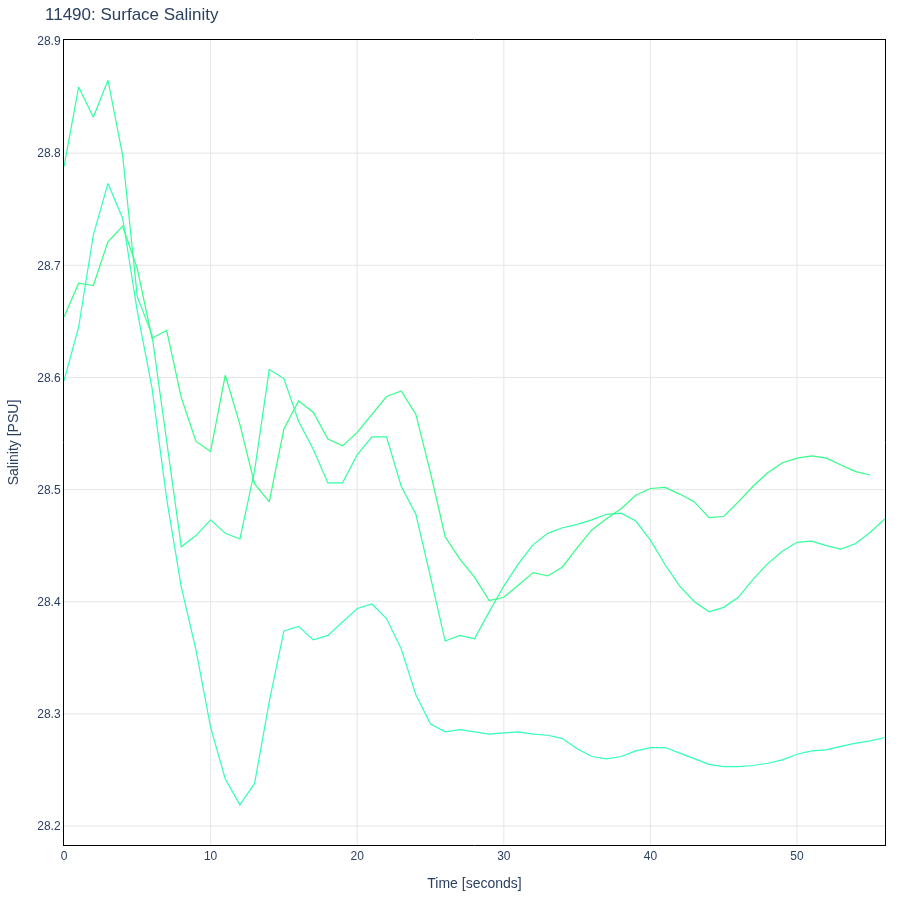
| 63 | Surface Salinity | surface | 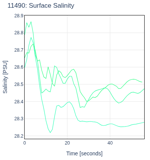 | surface_saln .html (186.0kB) .png [390x415] (37.1kB) .png [900x900] (87.2kB) |
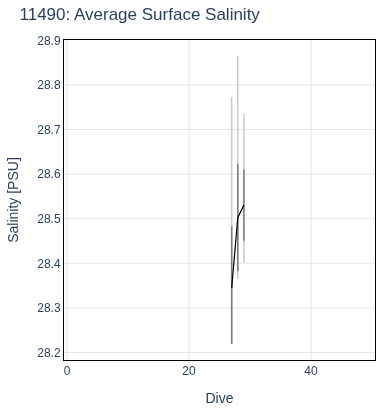
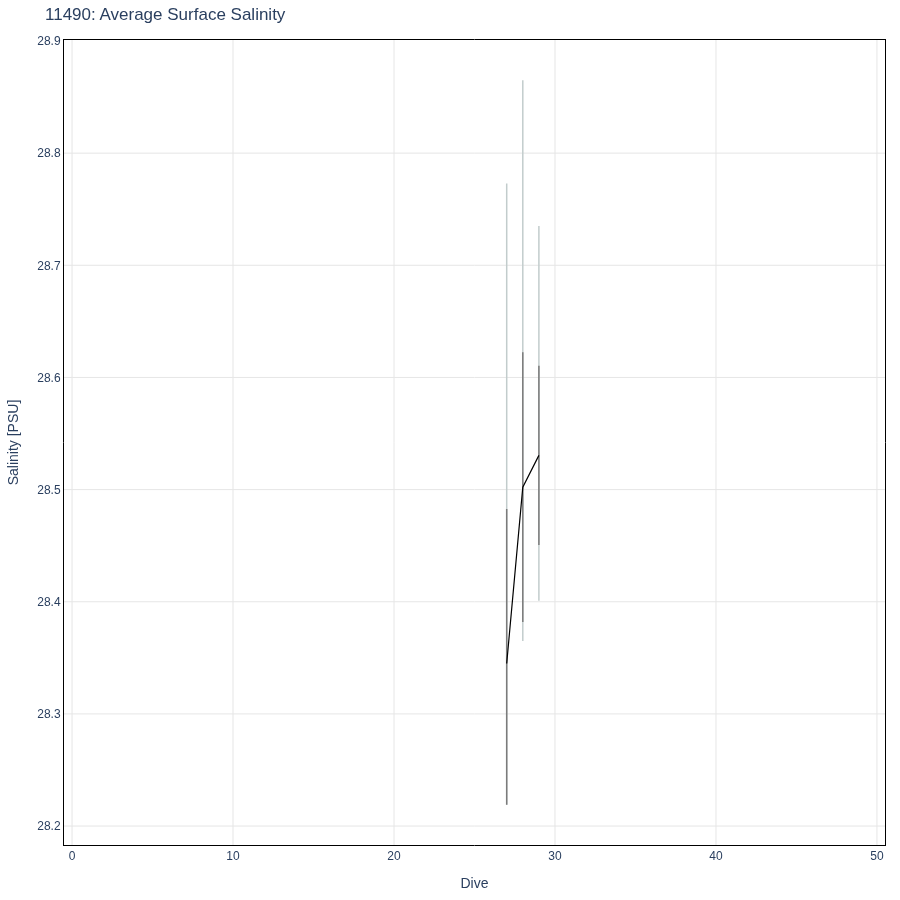
| 64 | Average Surface Salinity | surface | 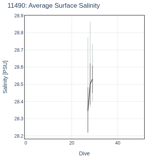 | surface_saln_avg .html (9.3kB) .png [390x415] (33.4kB) .png [900x900] (76.6kB) |
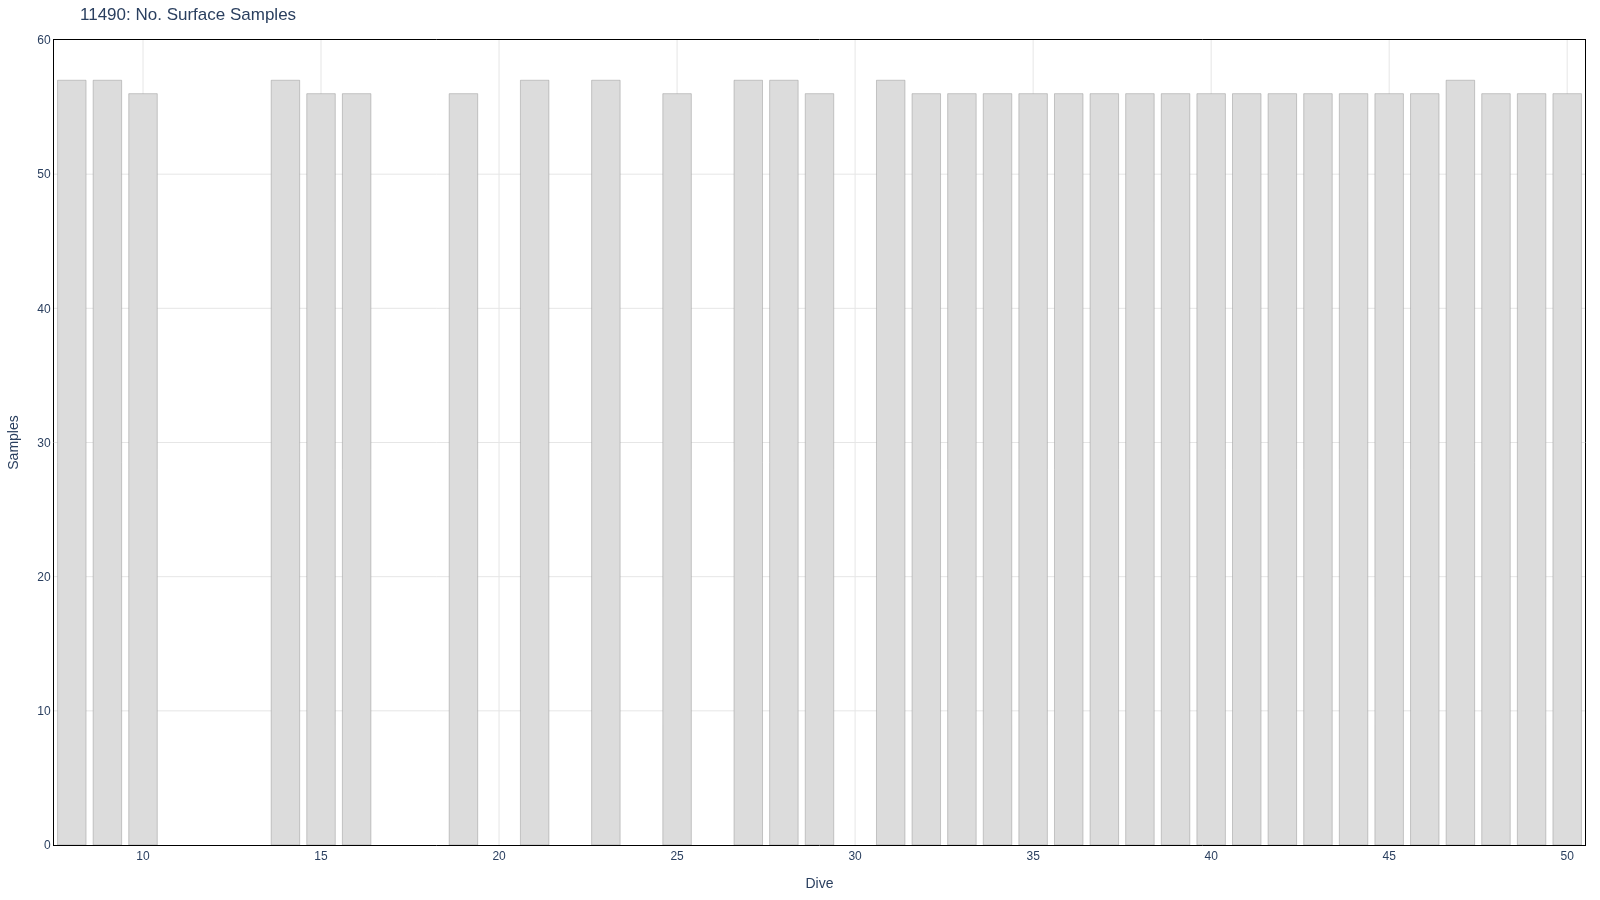
| 65 | No. Surface Samples | surface | 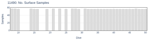 | surface_sample_count .html (8.6kB) .png [780x215] (19.4kB) .png [1600x900] (53.8kB) |
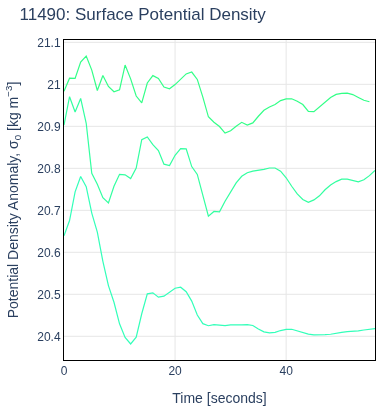
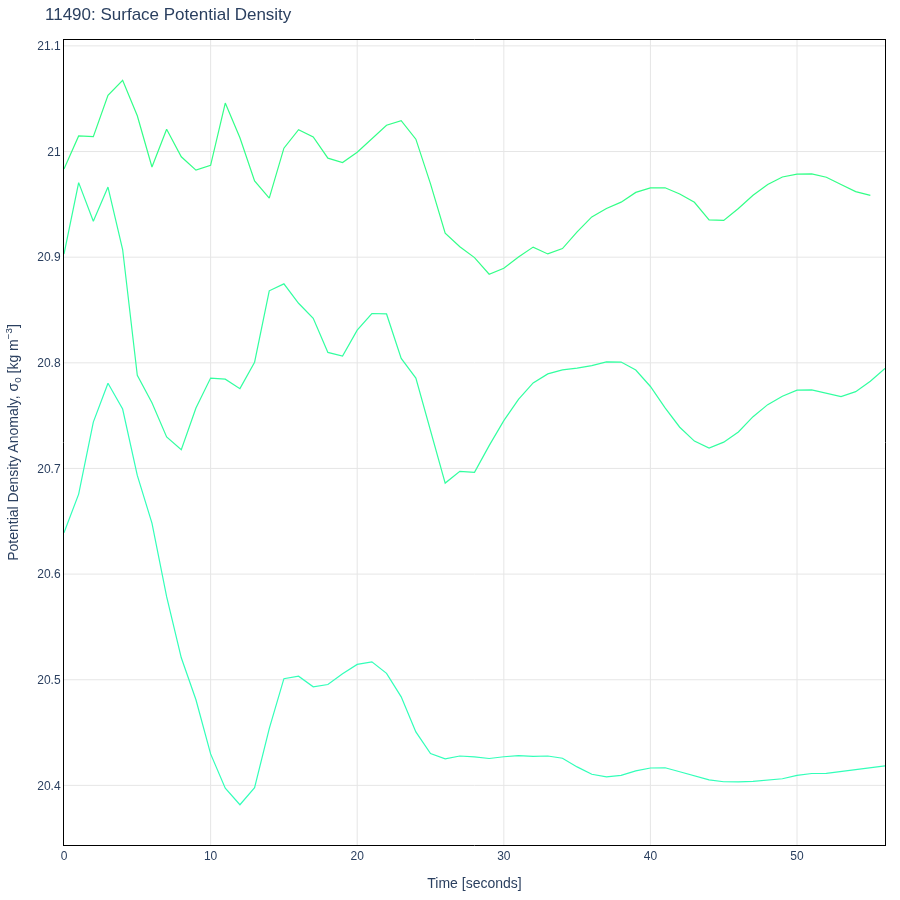
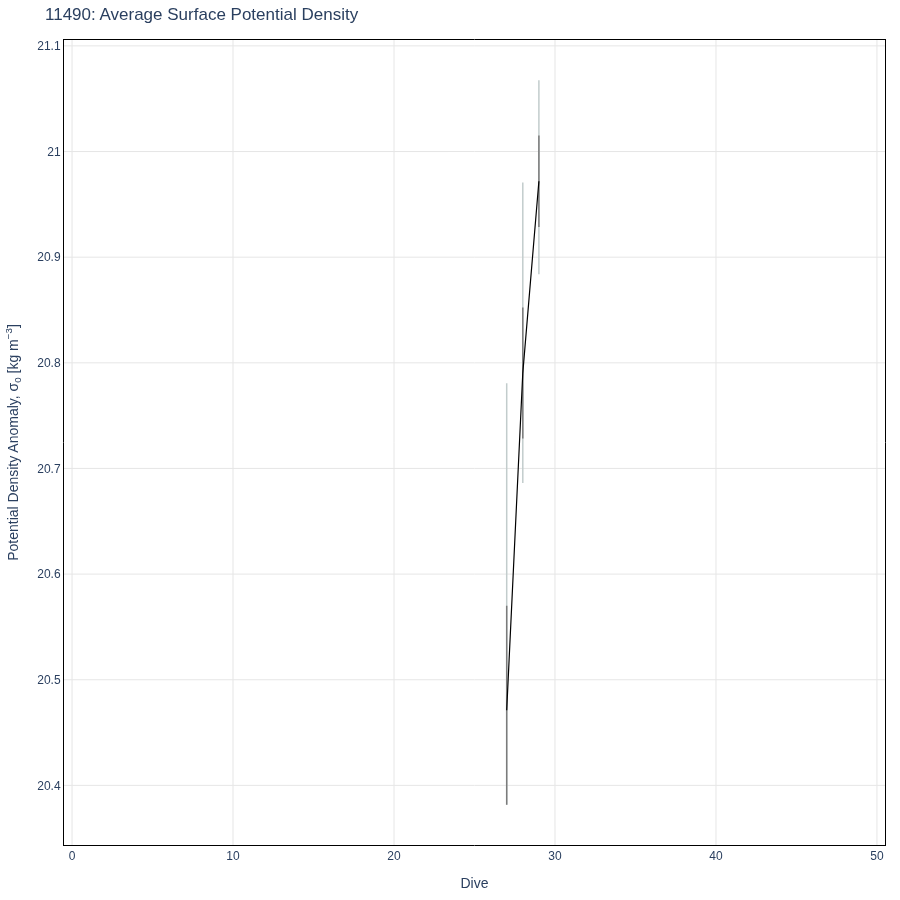
| 66 | Surface Potential Density | surface | 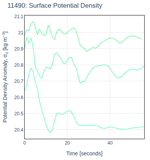 | surface_sigma0 .html (186.1kB) .png [390x415] (38.6kB) .png [900x900] (84.3kB) |
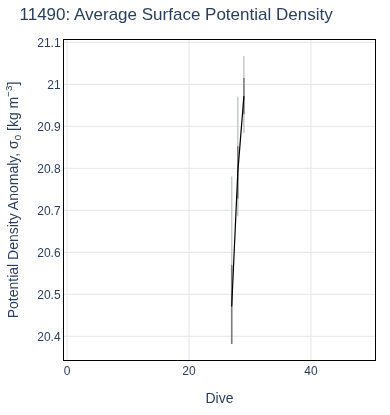
| 67 | Average Surface Potential Density | surface | 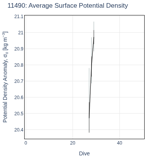 | surface_sigma0_avg .html (9.7kB) .png [390x415] (40.1kB) .png [900x900] (87.4kB) |
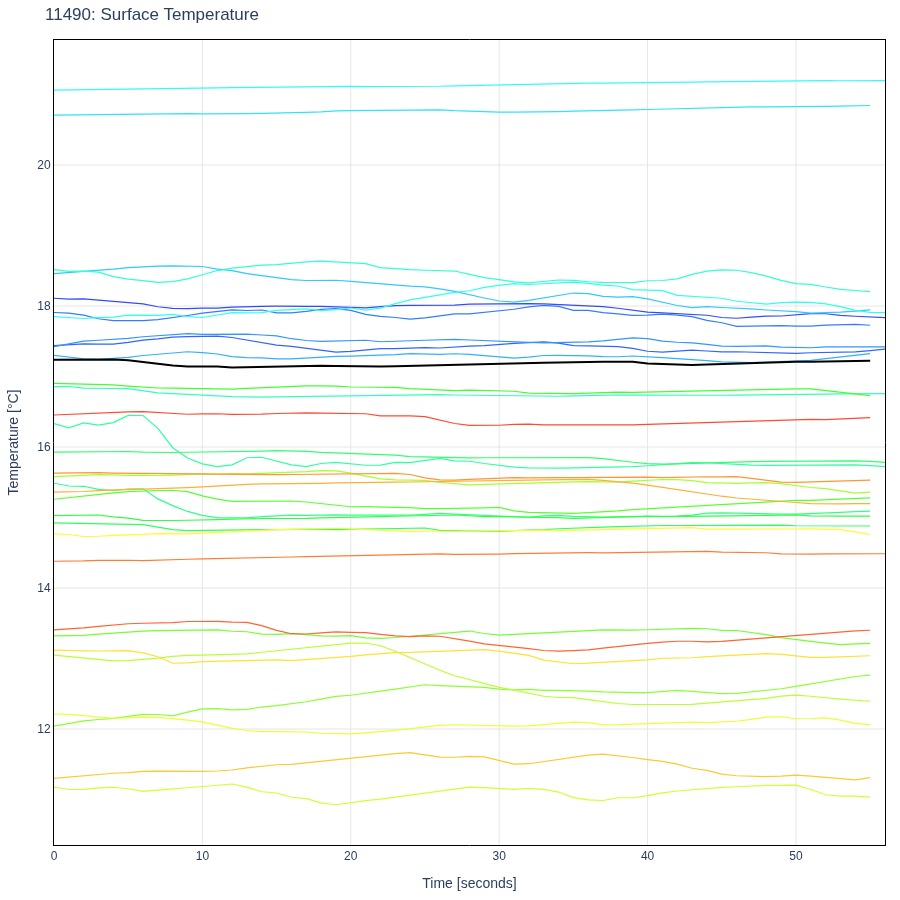
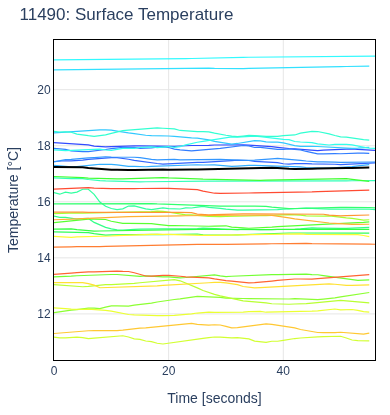
| 68 | Surface Temperature | surface | 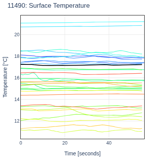 | surface_temp .html (184.2kB) .png [390x415] (84.1kB) .png [900x900] (227.4kB) |
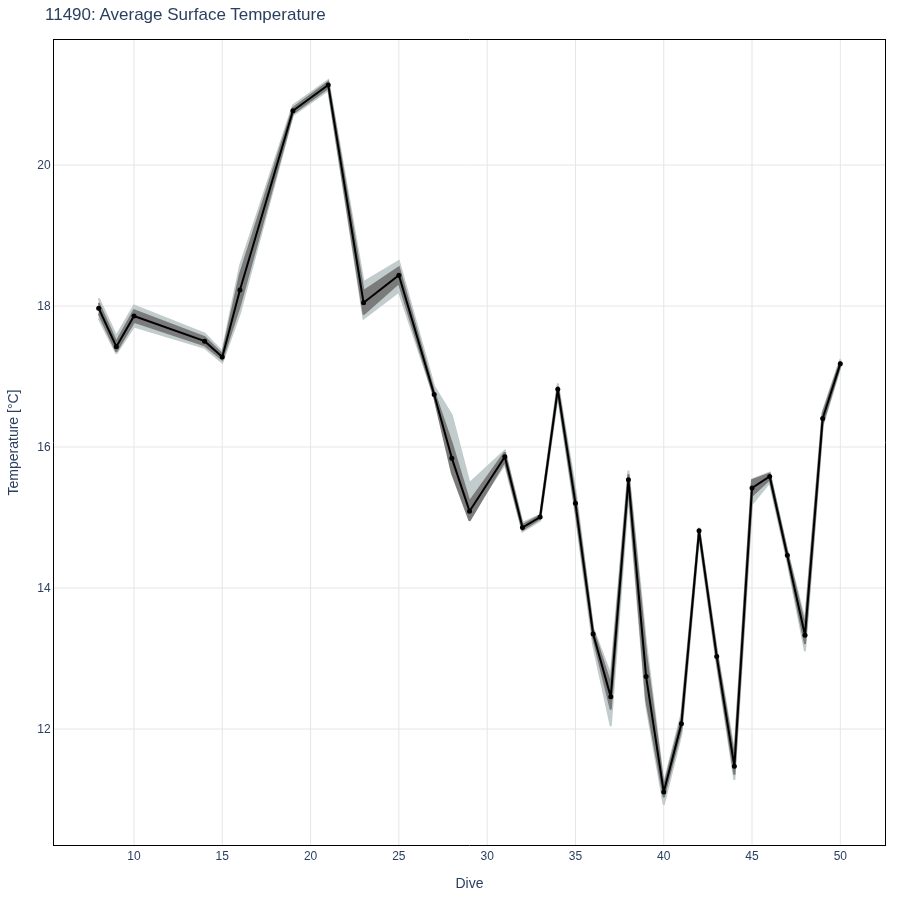
| 69 | Average Surface Temperature | surface | 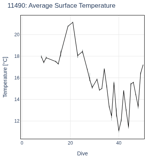 | surface_temp_avg .html (13.0kB) .png [390x415] (37.8kB) .png [900x900] (105.4kB) |
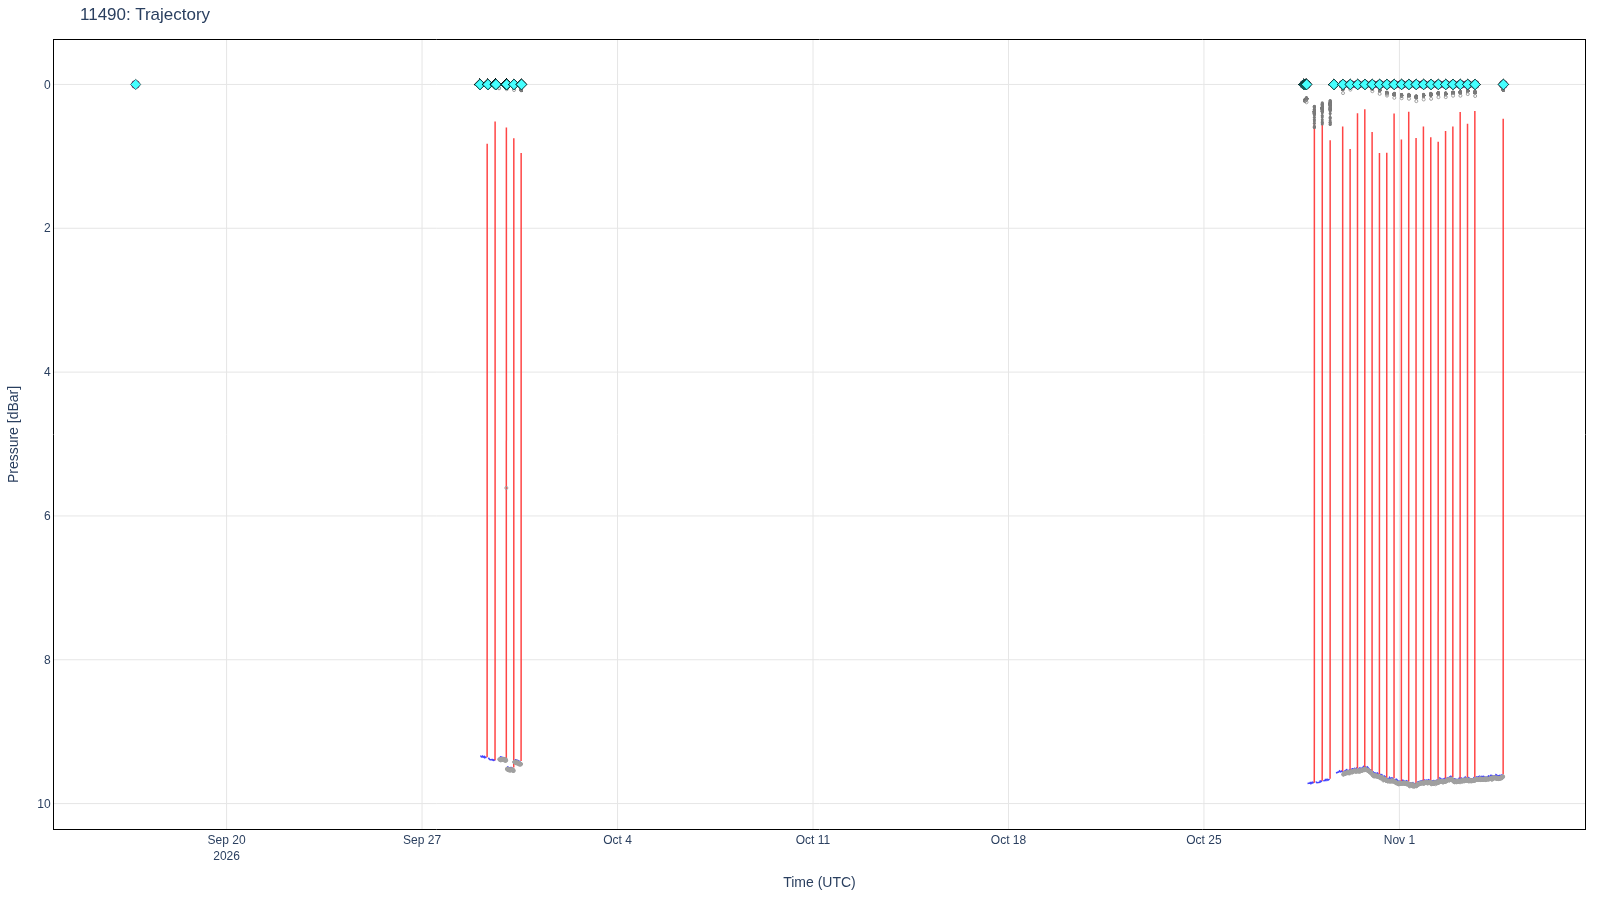
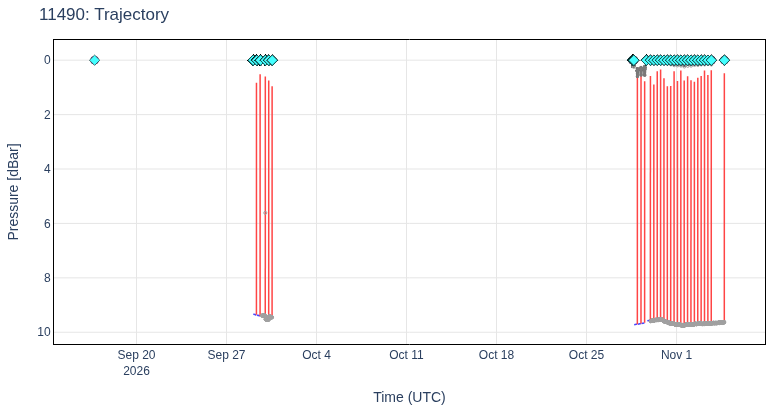
| 70 | Trajectory | trajectory | 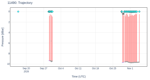 | trajectory .html (285.7kB) .png [780x415] (32.7kB) .png [1600x900] (70.2kB) |